Open Statistics.
The service must be running to read the metrics and cache state.
The view refreshes every ten seconds.
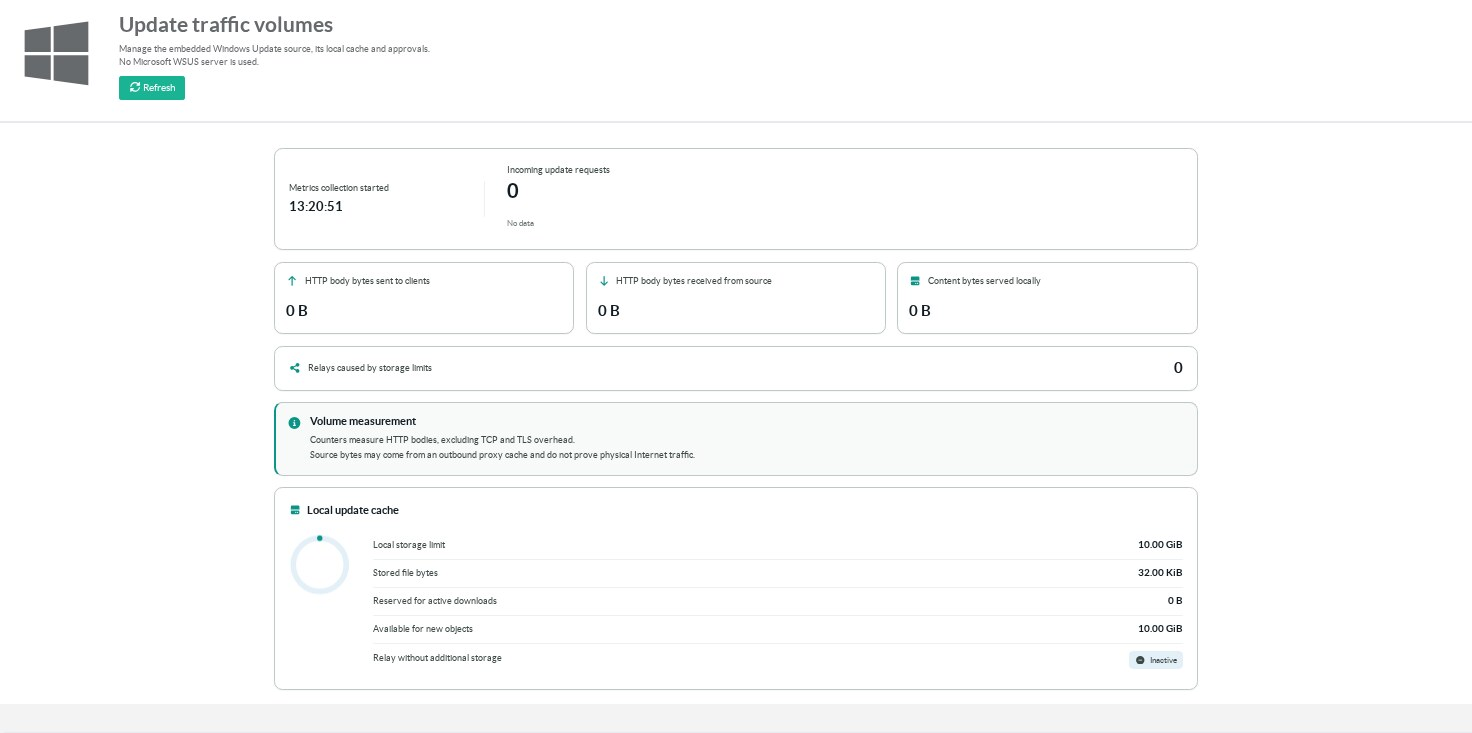
¶ Transfer counters
| Display | What it measures |
|---|---|
| Incoming update requests | Update requests received by Artica, including refused requests. |
| HTTP body bytes sent to clients | Response bodies written to clients. This includes protocol responses and errors. |
| HTTP body bytes received from source | Bodies read from the upstream source, including partial or failed transfers. |
| Content bytes served locally | Content served from an existing cached object or after a shared acquisition. |
| Relays caused by storage limits | Requests relayed without new storage because quota or free space was insufficient. |
These counters measure HTTP bodies.
They exclude TCP, TLS and HTTP header overhead.
When an outgoing proxy serves content from its own cache, source bytes are not a measurement of physical Internet traffic.
A downloaded byte count does not prove an installed update.
¶ Cache occupation
The cache section shows the storage allowance, stored file bytes, reserved bytes and capacity for new objects.
The relay indicator becomes active when additional content cannot be stored.
Existing files remain available locally in relay mode.
¶ History and persistence
Metrics are stored in a local bbolt database.
Lifetime counters survive service restarts.
The retention setting applies to minute samples, not the lifetime totals.
Missing periods in the chart are left as gaps rather than presented as confirmed zero traffic.
Request counts are recorded at entry.
Transfer bytes are recorded when the response finishes or closes.
A process failure can lose the byte count of an unfinished transfer.
Health and metric checks do not inflate update request counts.
¶ Read the figures together
- Client bytes rising with local bytes usually indicate cache reuse.
- Source bytes rising with little local reuse can indicate first downloads, expired cacheability or repeated relays.
- Relay counts rising with a full cache indicate that more disk allowance or free space is needed.
- Metric write errors require investigation before the counters are used for reporting.
Related: storage limits and troubleshooting.