Artica can show you, in real time and over time, every network connection the appliance currently knows about:
how many there are, who opens them, where they go, how much traffic they carry, and how close you are to the kernel's capacity limit.
This page explains what the feature gives you, when you want it, how to read the dashboard, and how to turn it off on appliances where you would rather not pay its cost.
The feature is built on the Linux kernel's connection tracking subsystem (nf_conntrack) and on the conntrackd daemon.
Artica reads both and stores a time series so you keep history, not just a live snapshot.
¶ What it gives you
- Capacity headroom at a glance.
The kernel refuses new connections once its tracking table is full, and it does so silently — users see random connection failures with nothing in the proxy logs.
The dashboard shows the current count againstnf_conntrack_maxas a percentage, so table exhaustion becomes something you see coming instead of something you diagnose afterwards.
- Who is actually using the appliance.
Top sources and top destinations rank the busiest IP addresses by number of connections and by bandwidth, computed live from the kernel table.
This answers "which machine is saturating us right now" without capturing packets.
- History, not just a snapshot.
Samples are recorded every minute and rolled up (hourly, daily, monthly), so you can compare today with last week, correlate a slowdown with a connection spike, and keep evidence after the incident is over. - A connection-lifecycle view.
Created, updated and destroyed counters separate "many connections because many arrive" from "many connections because none are being released" — two very different problems.
- Per-CPU pressure indicators.
Dropped, invalid and failed-insert counters are reported per CPU core, which is where kernel-level congestion shows up first.
- No extra agent.
Everything comes from the kernel and from a daemon already present on the appliance.
There is nothing to install on clients and no traffic mirroring to configure.
¶ Use cases
| Situation | How this feature helps |
|---|---|
| Users report intermittent, unexplained connection failures | Check the usage percentage. If the tracking table is at or near 100 %, the kernel is dropping new connections. Raise nf_conntrack_max, or find and fix whatever is opening connections faster than they expire. |
| A single client is degrading the whole network | Top sources ranks clients by open connections. A workstation with thousands of connections is usually infected, running a peer-to-peer client, or scanning — it stands out immediately. |
| Suspected scanning or malware beaconing | A host with a very high connection count but very little bandwidth is a strong scan signature: many connections, almost no data on each. The bandwidth column next to the connection count makes that pattern obvious. |
| Sizing an appliance before rollout | Watch the 7-day and 30-day views to see real peaks rather than averages, and size nf_conntrack_max and memory on the peak. |
| Capacity planning and growth reporting | The monthly roll-up gives a defensible trend line for "we need a bigger appliance" conversations. |
| Post-incident analysis | Because history is stored, you can go back to the exact minutes of an outage and see whether connections spiked, whether the table filled, and whether any CPU core started dropping. |
| Verifying a stateful firewall is doing its job | If you run firewall rules that match connection state, tracking must be active for them to work at all. A count stuck at zero tells you the state machine is not running. |
¶ Where to find it
The dashboard is a tab of the Artica home dashboard.
Log in, then open Dashboard and select the Connections tab.
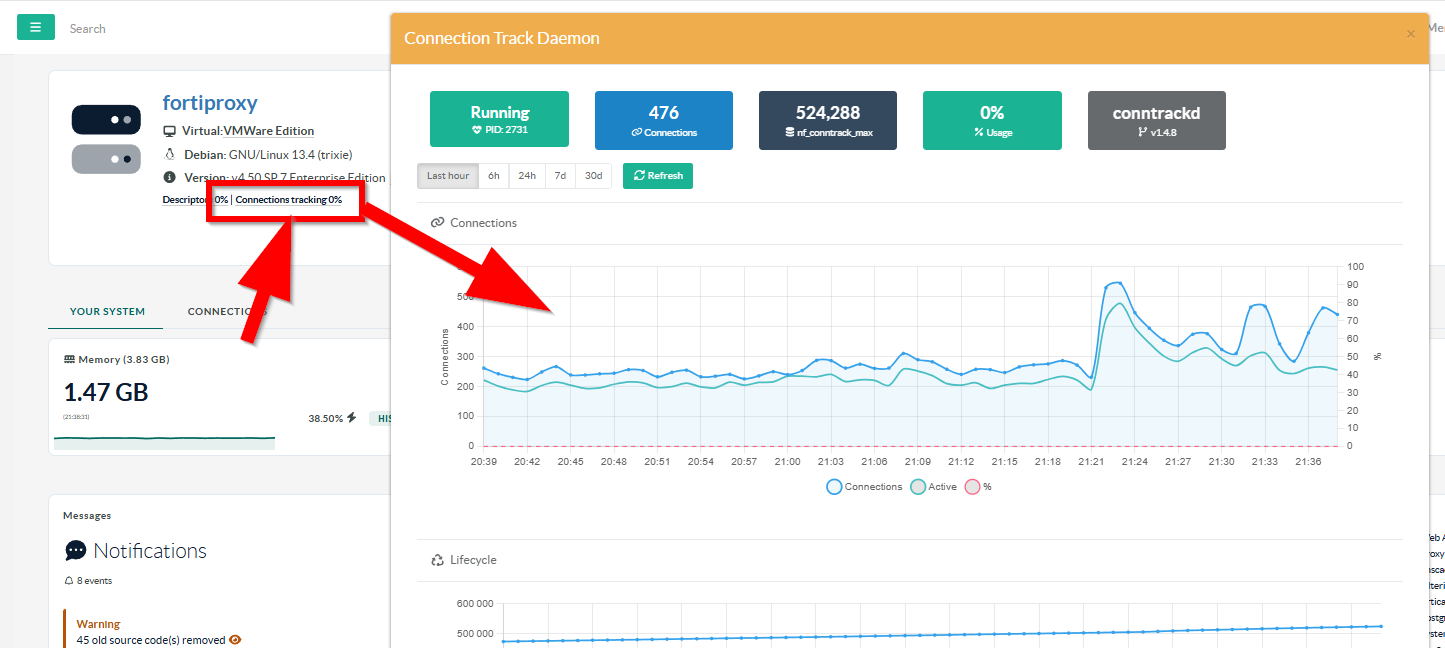
¶ Reading the dashboard
The summary row
| Widget | Meaning |
|---|---|
| Running / Stopped | State of the conntrackd daemon, with its process identifier. |
| Connections | Number of connections the kernel is tracking right now. |
| nf_conntrack_max | The kernel's hard ceiling. New connections are refused beyond it. |
| Usage | Connections as a percentage of that ceiling. It turns orange above 50 % and red above 80 %. |
| conntrackd | Version of the daemon in use. |
The Usage widget is the one to watch.
Anything sustained above 80 % deserves attention before it becomes an outage.
- Time ranges
The buttons under the summary row select the period: Last hour, 6h, 24h, 7d and 30d.
Artica picks the appropriate level of detail automatically — per-minute samples for short ranges, hourly averages for a day or two, daily averages beyond that.
On aggregated ranges the connections chart also draws faint peak and min lines, so a short spike is not hidden by the average.
- Connections
Total tracked connections and active connections, plus table usage as a percentage on the right-hand axis.
A gap between the two lines is normal: the total includes connections in transient states, the active line counts established ones.
- Lifecycle:
Connections created, updated and destroyed. Read it as a balance sheet:
if created stays well above destroyed for a long period, connections are accumulating and the table will eventually fill.
- Bandwidth
Traffic carried by the tracked connections, in megabytes and packets.
This is accounting data attached to each kernel entry, so it covers everything the appliance forwards, not only proxied traffic.
- Realtime requests
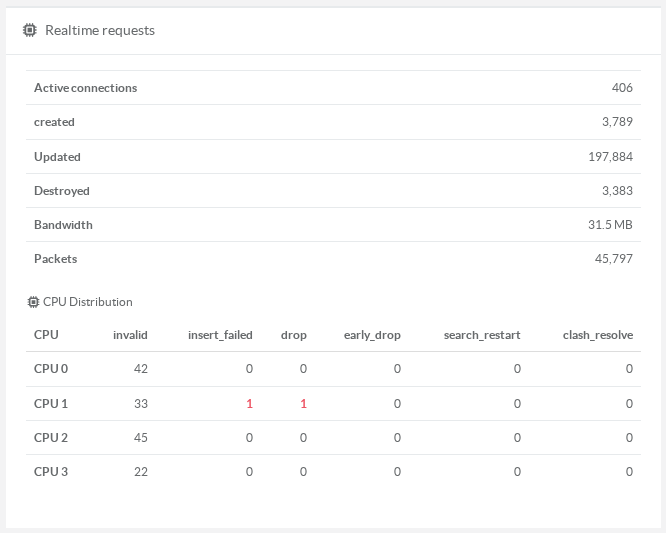
Live counters read directly from the kernel and the daemon, refreshed each time you reload the panel.
The CPU Distribution table underneath reports per-core counters using the exact names the conntrack -S command prints, so you can cross-check on the console:
| Counter | What a non-zero value means |
|---|---|
invalid |
Packets the tracker could not associate with a connection. A low, steady level is normal on any network. |
insert_failed |
A new connection could not be recorded. Usually a sign of table pressure or of racing duplicate packets. |
drop |
Packets dropped by the tracker. This is the one that hurts users. Sustained values mean the table is too small or under attack. |
early_drop |
The kernel evicted older entries to make room. The table is effectively full. |
search_restart |
Internal lookup restarts caused by concurrent changes. High values indicate heavy contention. |
clash_resolve |
Two CPUs inserted the same connection simultaneously. Benign in small numbers. |
Values other than invalid are highlighted in red when they are not zero, because unlike invalid they always indicate a problem worth investigating.
Compare cores: figures concentrated on one core usually point to an interrupt-affinity or queue-distribution problem rather than to a lack of capacity.
Top sources and top destinations:
The ten busiest addresses, each with its connection count, a proportional bar, and the bandwidth carried.
Loopback addresses are filtered out. Sort criteria is the connection count.
Read the two columns together. Many connections with a lot of bandwidth is a heavy but legitimate user; many connections with almost no bandwidth is the classic scanning or beaconing pattern.
¶ Turning connection tracking off
Tracking is enabled by default, and that is the right setting for the vast majority of appliances.
It can be turned off on an appliance where the extra kernel work is not worth the visibility.
- What it costs
The kernel allocates one tracking entry per network flow — roughly 300 bytes each.
On an appliance whose ceiling is 524 288 entries that is about 150 MB in the worst case, plus a small amount of CPU per packet.
On a busy appliance with a small tracking table there is also a real risk: once the table fills, the kernel starts dropping new connections.
When turning it off makes sense:
- The appliance runs a stateless rule set only — a pure transparent-proxy deployment, for instance — so nothing needs connection state to make a filtering decision.
- The appliance is memory-constrained and you do not use the connection statistics.
- You are deliberately trading observability for the last few percent of throughput.
Do not turn it off if you use any firewall rule that matches connection state, or any form of network address translation: those features need the tracker and will stop behaving correctly without it.
How to turn it off
Go to Your system → System information.
The Connection tracking line shows the current state.
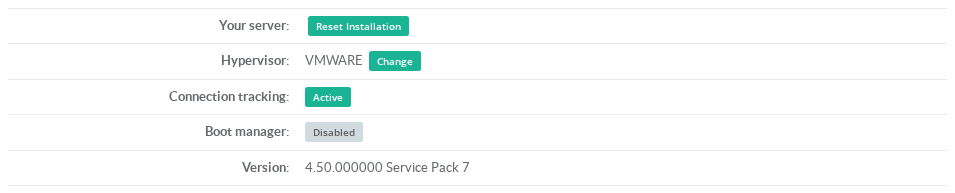
Click the state badge to open the settings window, then switch Disable connection tracking on.
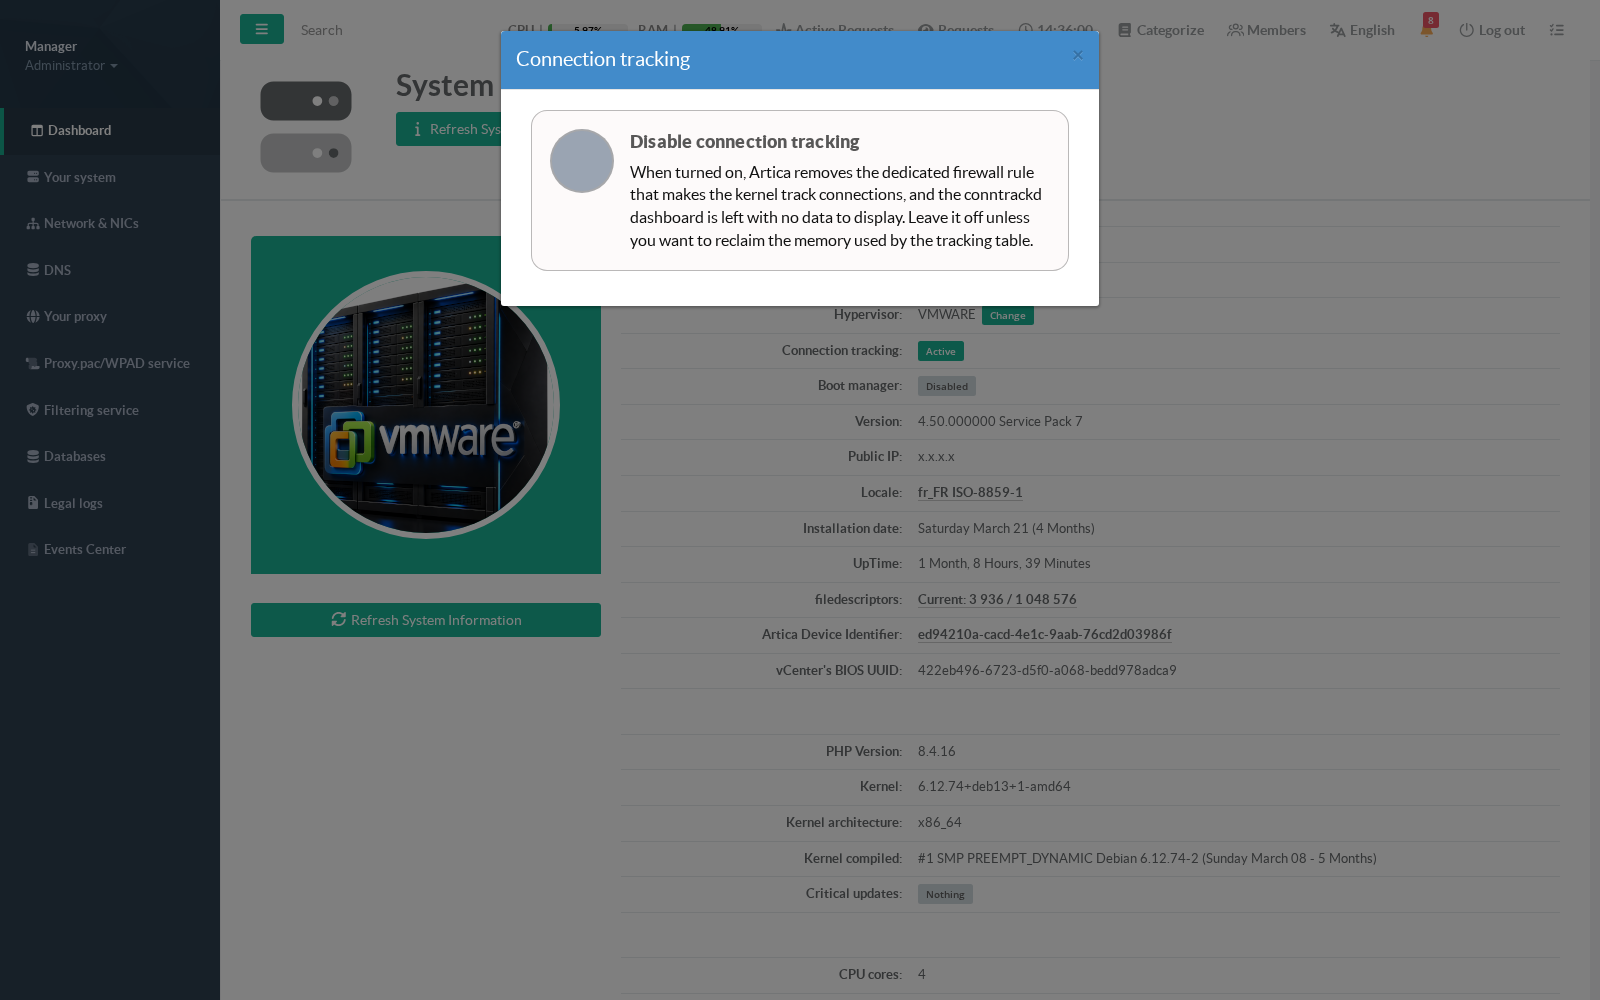
The change is applied immediately — there is no service to restart and no Apply button to press; closing the window is enough.
The line then reports the new state:
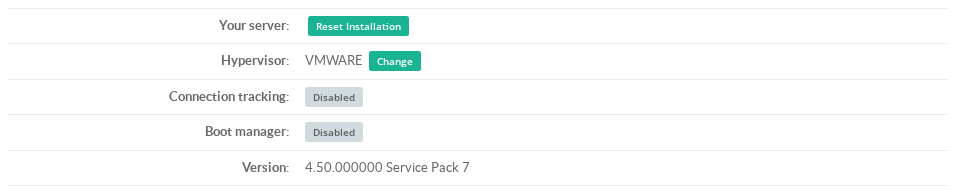
Set the same switch back off to resume collecting statistics.
Existing connections already recorded by the kernel are not removed when you disable tracking; they simply expire normally, so the dashboard fades out over the following minutes rather than emptying instantly.
When the dashboard reports no data

There are two reasons this message appears.
- An administrator turned tracking off
The message names the setting explicitly.
Re-enable it as described above and data starts accumulating within a minute.
- Nothing is asking the kernel to track
This one is worth understanding, because it is counter-intuitive.
Loading the kernel's tracking module is not enough to make it track anything: modern Linux kernels only start tracking once a firewall rule actually asks for connection state.
A daemon that merely reads the tracking table does not count — it will happily report zero forever.
On an appliance whose firewall is entirely stateless, no rule ever makes that request. Artica therefore installs a dedicated rule of its own for the sole purpose of switching the kernel's tracking on. The rule sits in its own chain that no traffic ever reaches, so it cannot allow, block or alter a single packet — it exists purely to enable the counters.
If you see this message while the setting is enabled, check that the rule is present on the appliance:
iptables -S ARTICA_CONNTRACK
It is re-created automatically within three minutes if something removed it — a firewall rebuild, for example — so a missing rule is normally self-healing.
You can also force it immediately from the API below.
¶ REST API
All endpoints are served on the local Artica socket and answer with a {"success": …, "data": …} envelope.
| Endpoint | Returns |
|---|---|
GET /conntrackd/status |
Daemon state, version, current count, ceiling, usage percentage, and whether tracking is engaged or was disabled by an administrator. |
GET /conntrackd/live |
Live kernel, daemon and per-CPU counters. |
GET /conntrackd/metrics?range=1h|6h|24h|7d|30d |
History for the requested period, at the appropriate level of detail. |
GET /conntrackd/top-sources?limit=10 |
Busiest source addresses. |
GET /conntrackd/top-destinations?limit=10 |
Busiest destination addresses. |
GET /conntrackd/tracking/apply |
Applies the master switch to the kernel immediately instead of waiting for the next watchdog pass. |
GET /conntrackd/stats |
Size and contents of the statistics database. |
POST /conntrackd/{start|stop|restart|reconfigure} |
Daemon lifecycle. |
Example:
SOCKET=/usr/share/artica-postfix/bin/run/articarest.sockcurl -s --unix-socket $SOCKET http://localhost/conntrackd/statuscurl -s --unix-socket $SOCKET http://localhost/conntrackd/tracking/apply
¶ Troubleshooting
| Symptom | What to check |
|---|---|
| The Connections tab is missing from the dashboard | The conntrackd daemon is not enabled on this appliance, or your account lacks general administrator rights. |
| Charts are empty and the page shows the "not engaged" message | See the section above: either tracking was disabled, or the dedicated rule is missing. Check iptables -S ARTICA_CONNTRACK. |
| Usage is close to 100 % | Raise nf_conntrack_max, or reduce what is opening so many connections. Check top sources for a single offender first — it is often one host, not genuine growth. |
drop or early_drop keeps rising |
The tracking table is too small for the load, or the appliance is under a connection flood. Both call for the same first step: identify the top source. |
| Counters concentrated on a single CPU core | Look at network-interrupt affinity and receive-queue distribution rather than at tracking capacity. |
| The daemon shows as stopped | Restart it from the API (POST /conntrackd/restart). Note that the kernel keeps tracking connections regardless: the daemon supplies the lifecycle counters, not the tracking itself. |