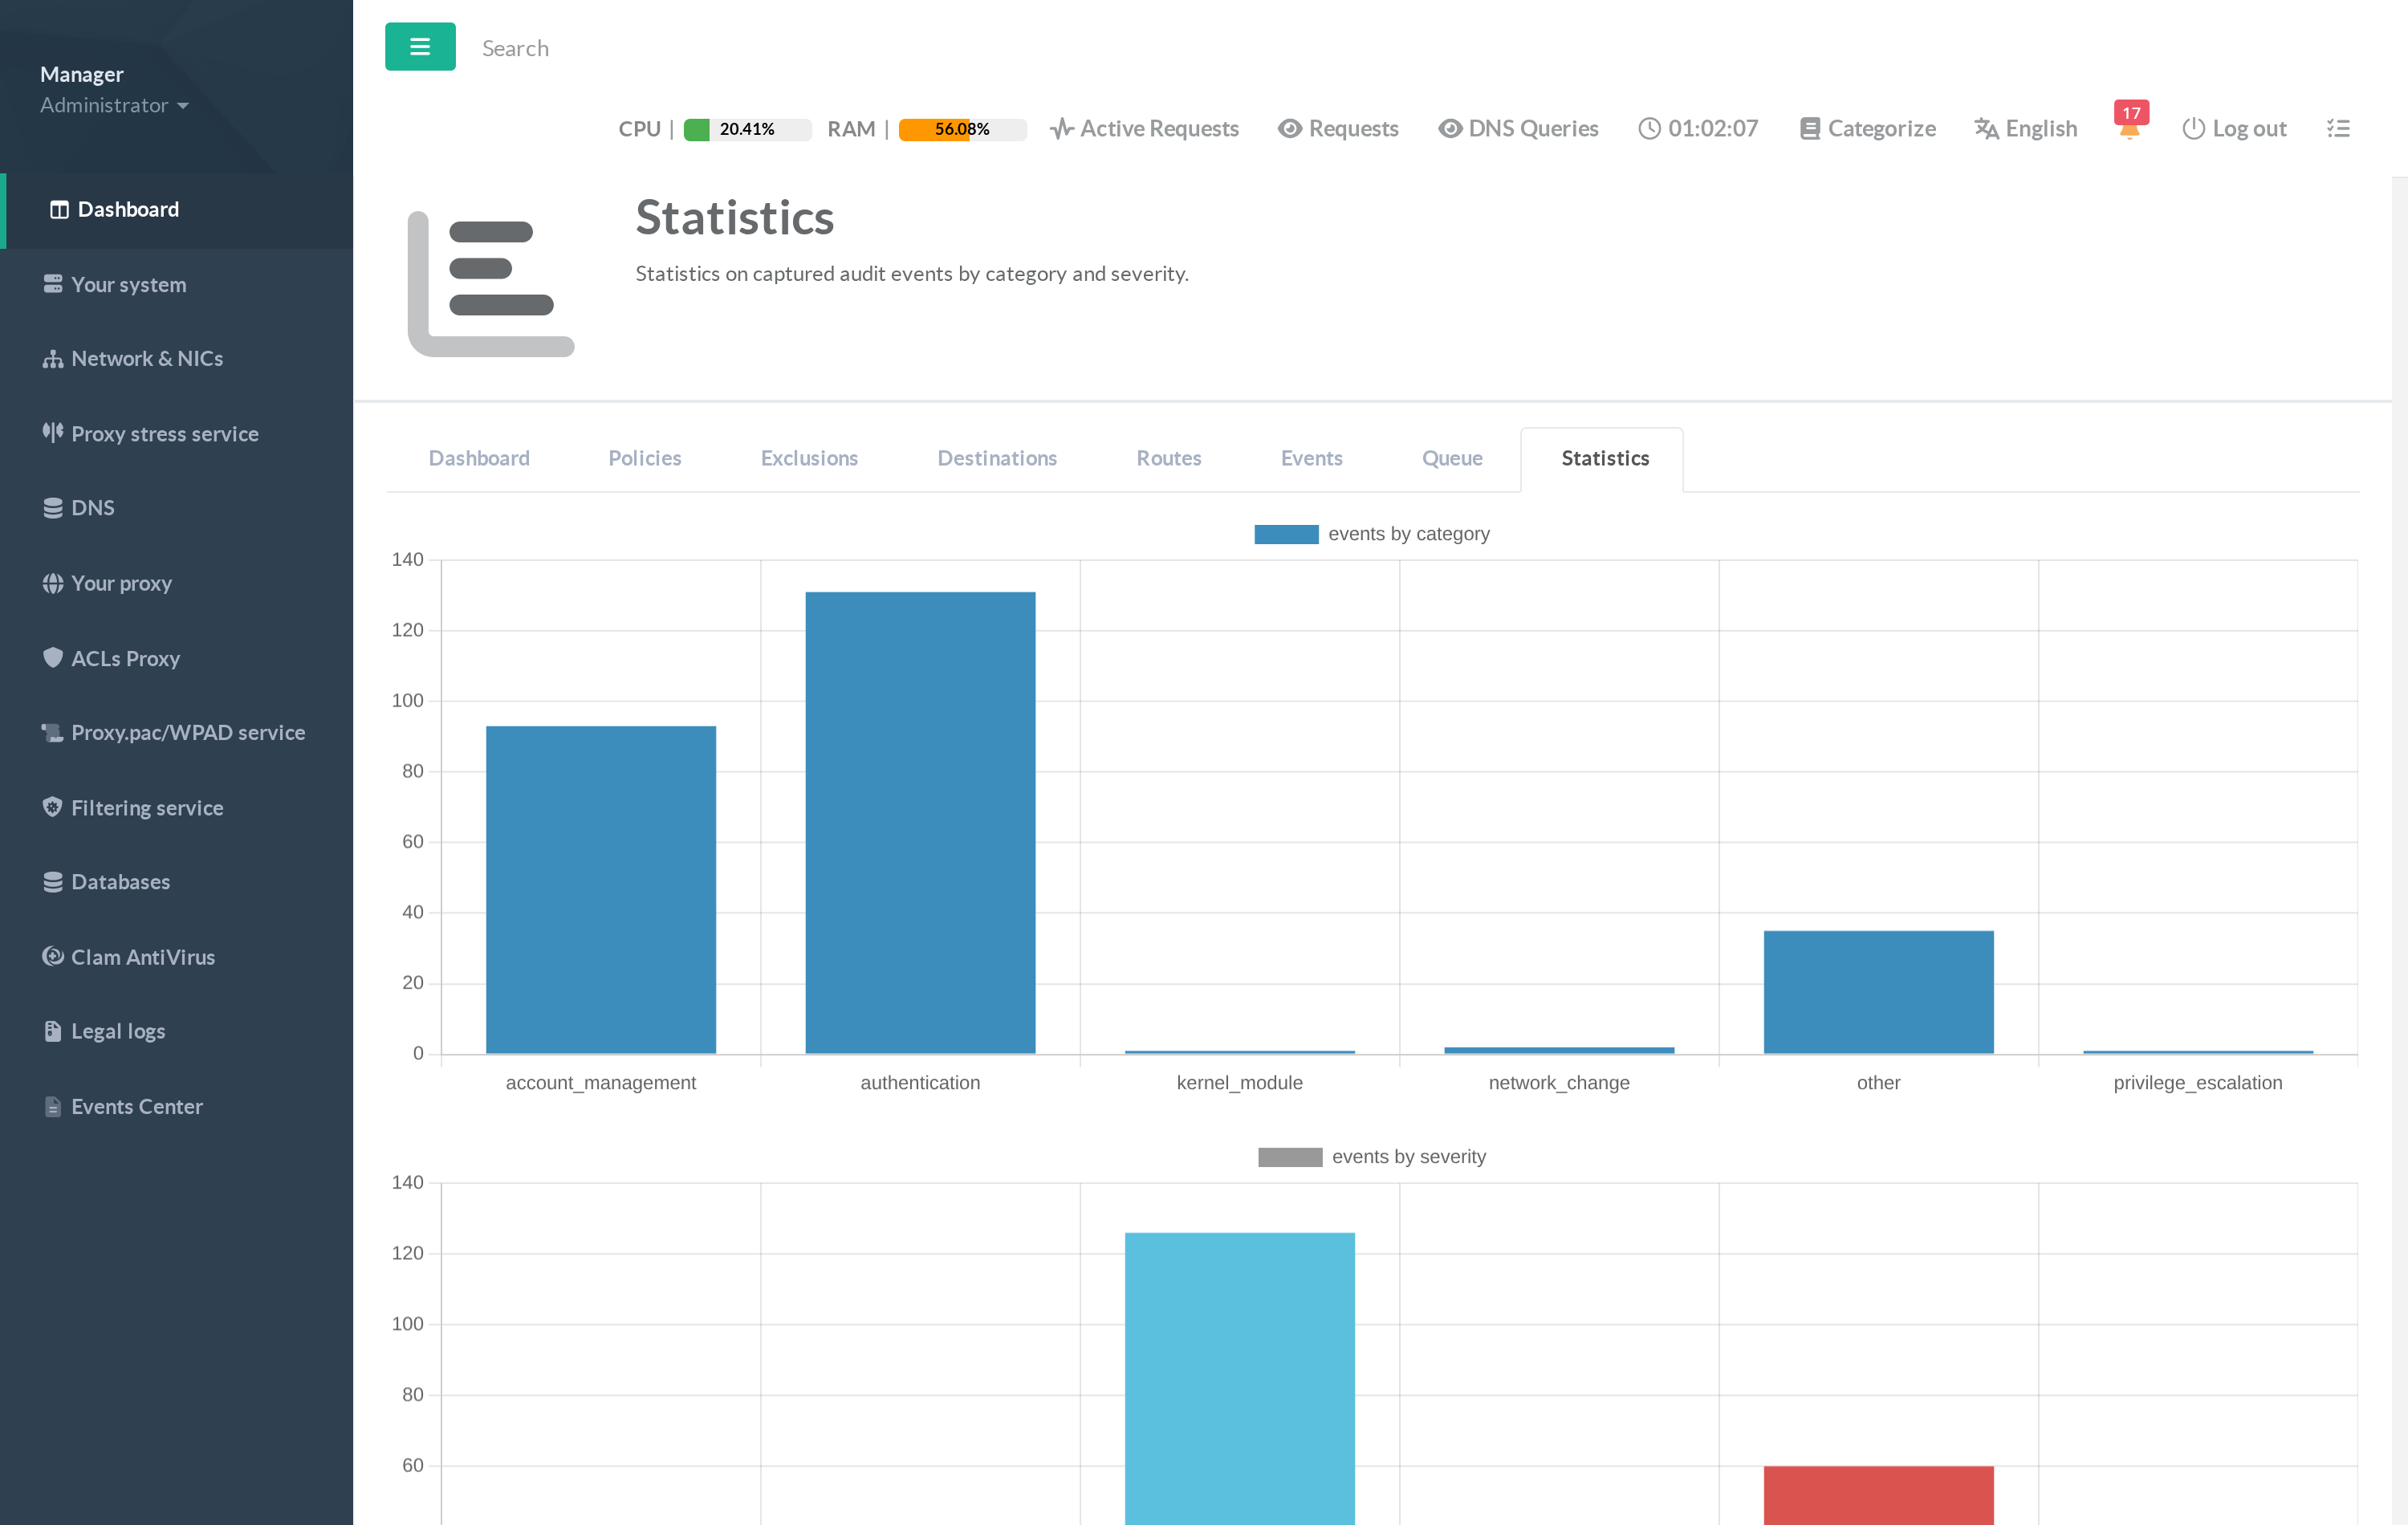
The Statistics tab summarises the captured audit events as charts, so you can see the shape of activity on the appliance at a glance.
¶ What the charts show
- Events by category — how many events fall into each class (authentication, account management, audit configuration, kernel module, network change, …). A sudden spike in
privilege_escalationoraccount_managementis worth investigating. - Events by severity — the distribution across severities 0–5. This tells you how much of your traffic is high-value (severity 4–5) versus routine.
¶ How to use it
Use the category breakdown to tune your pipeline: a category that dominates the chart but has little security value is a good candidate for an exclusion, while the high-severity band is what your policies and routes should make sure to forward.