Rules & Rulesets is the detection itself: the OWASP Core Rule Set, EdgeGuard's own rules, and any you write. Unlike a firewall rule, these do not decide alone — each match adds a score, and the request is refused when the total crosses the site's threshold.
¶ How detection decides
A request that survives the earlier steps — path rules, IP lists, threat intelligence, geo, firewall rules, bots, rate limits — reaches the rulesets. Then:
- Every enabled rule whose category is enabled, and whose paranoia level is within the site's, is evaluated against the parts of the request it targets.
- Each rule that matches contributes its score. One hit per category: five SQLi patterns matching is still one SQLi hit.
- The scores accumulate into an anomaly total.
- The total is compared with the site's Inbound Anomaly Threshold (Global Settings → General; default 5). At or above it, the request is refused.
So a rule scoring 5 blocks on its own at the default threshold, and two rules scoring 3 block together. This is why raising the threshold is a blunt instrument: it does not make one noisy rule quieter, it makes every combination harder to reach.
Static assets skip this step. A plain file fetch has no injection surface, and the regex work is the most expensive thing the engine does, so the fast path leaves it out.
Paranoia levels. Every rule carries one. PL1 rules always run; a rule at PL2 or above runs only if the site's CRS Paranoia Level is at least as high. PL1 is the default and is what you should stay on until you have time to tune: PL2 and above trade false positives for coverage, deliberately.
Category switches win. Turning a category off in Global Settings → Attack Detection silences both EdgeGuard's own matchers and the CRS rules of that category — including when a path rule turns it off for one path. Without that, disabling "RCE detection" would silence the built-in detector while CRS 932xxx kept scoring, and the request would stay blocked for a reason the setting appeared to cover. Categories with no switch — protocol, Log4Shell, custom — always evaluate.
There is a time budget. A crafted input can make many rules backtrack; the engine stops evaluating early, keeps what it found, and records that it did, rather than spending a core on one request.
¶ Managed Rulesets
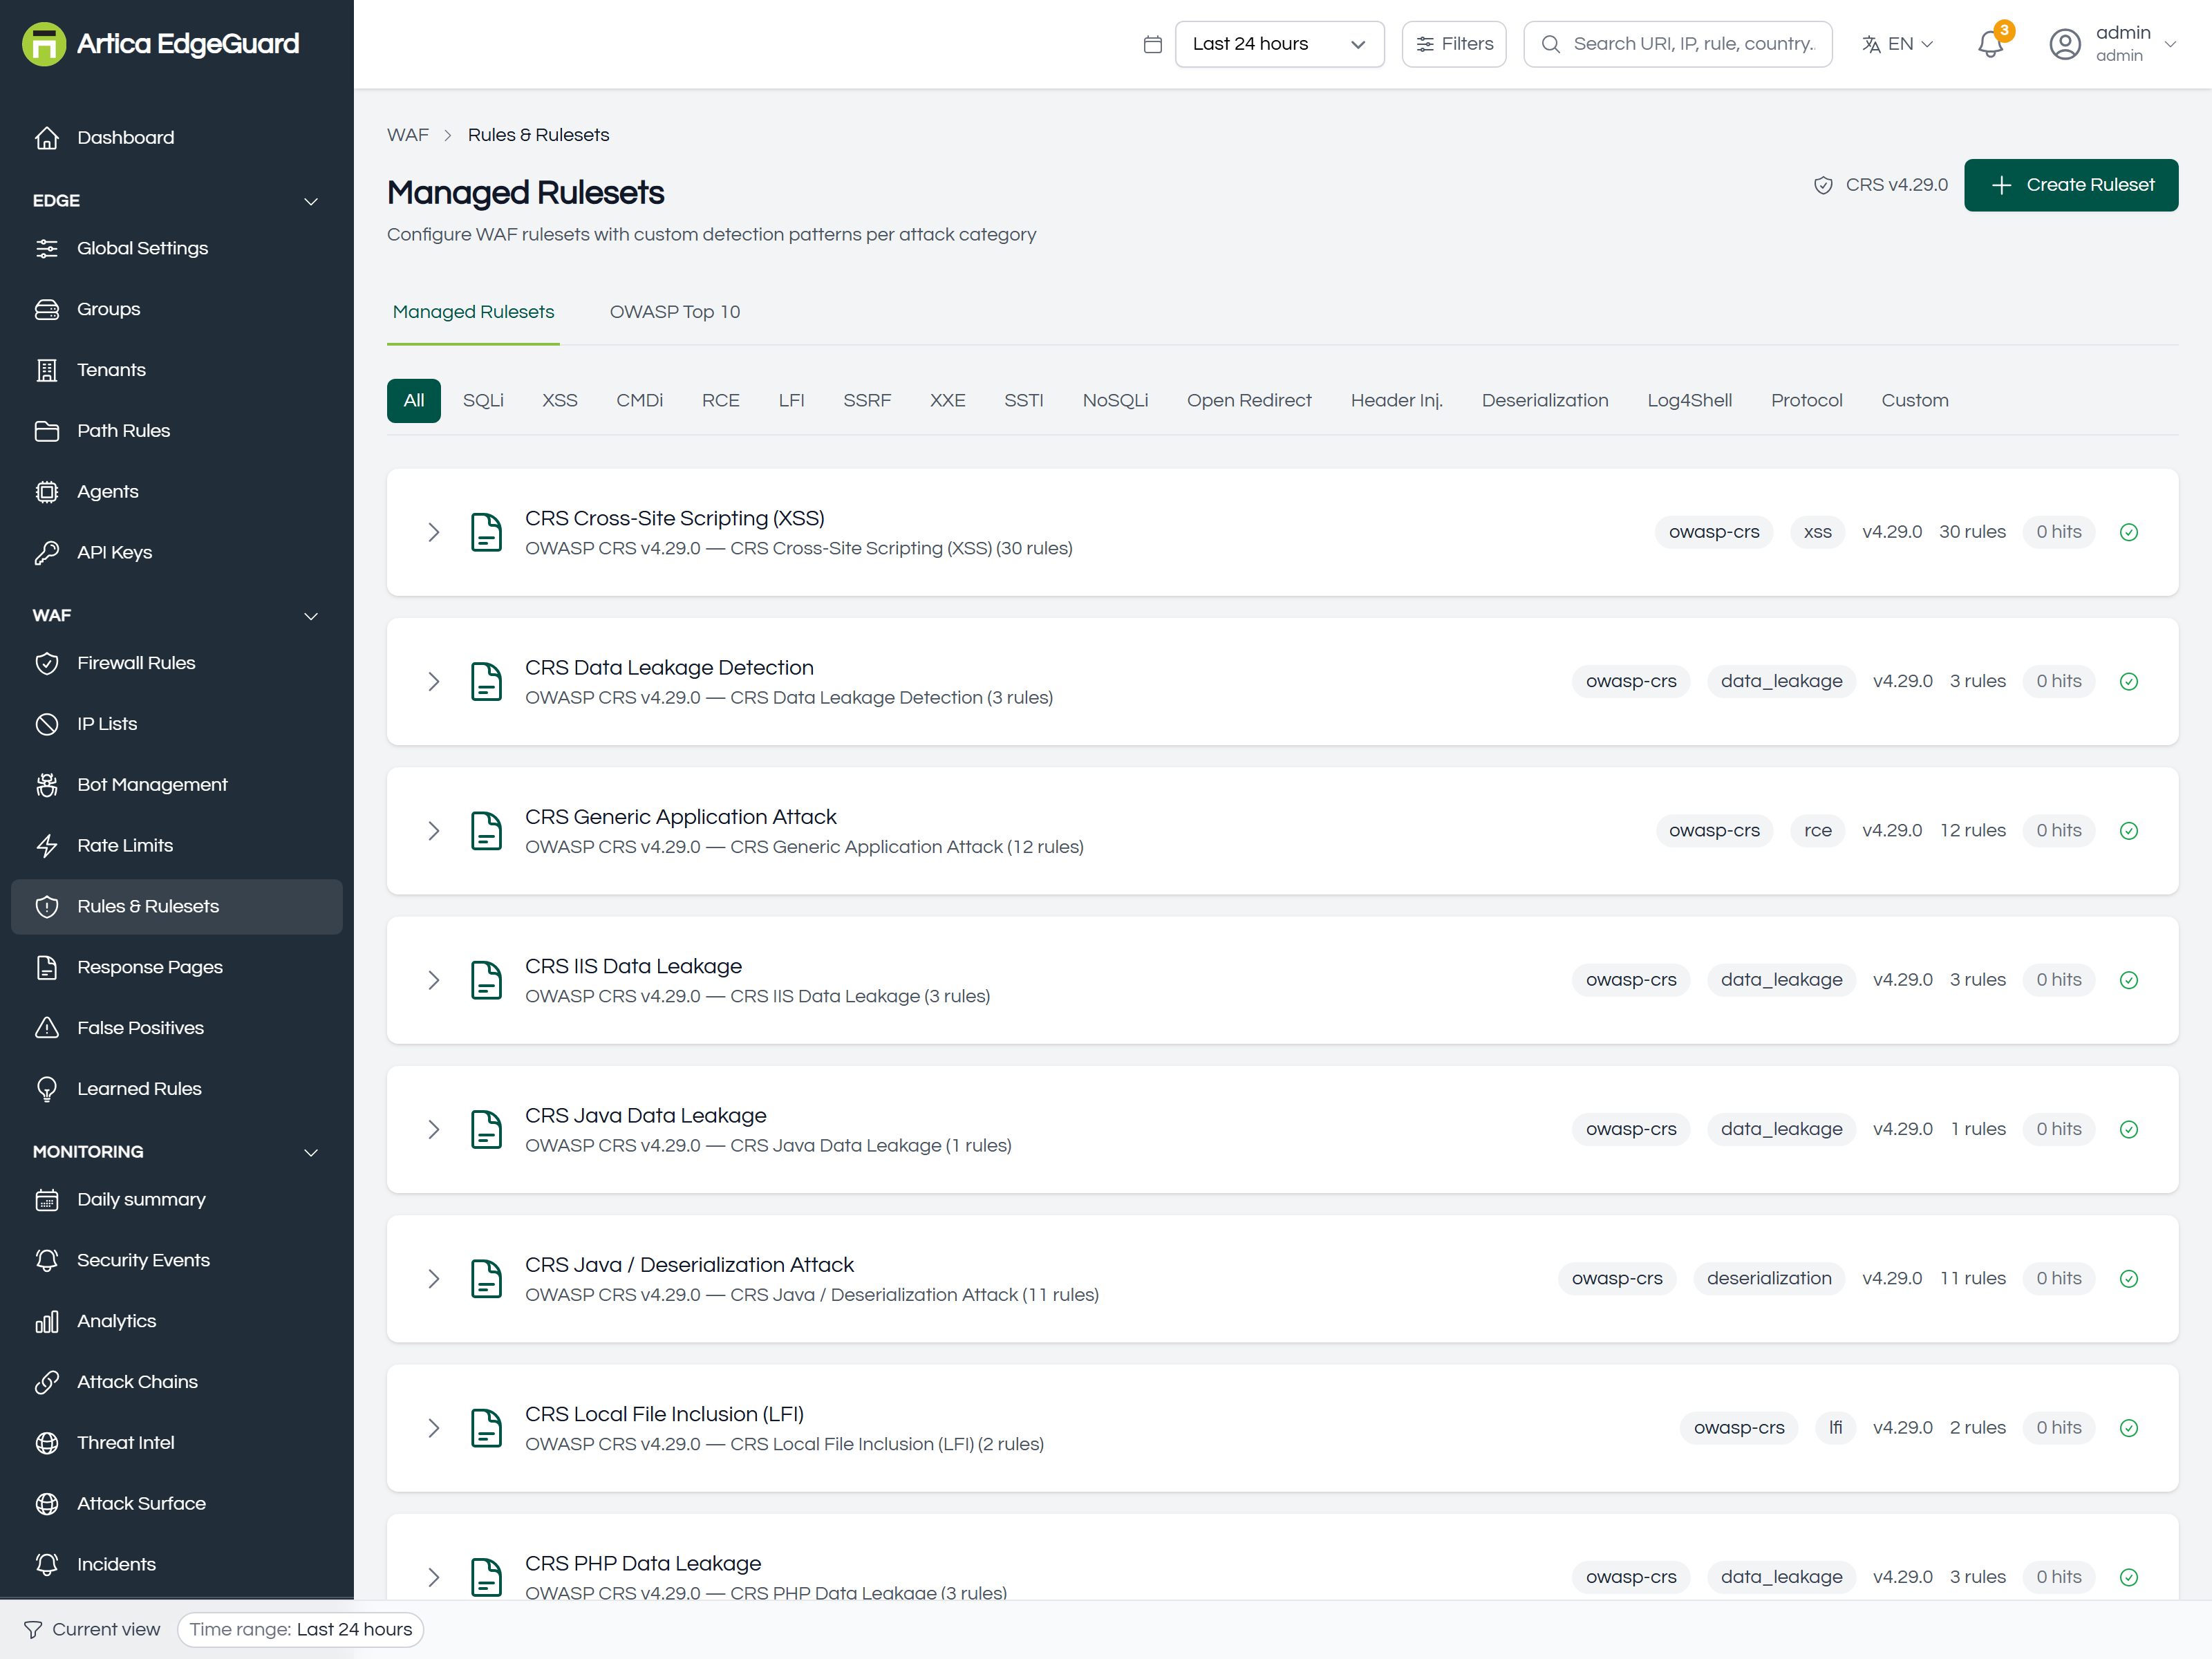
One card per ruleset. Each shows the source (owasp-crs), its category tag (sqli, rce, lfi, protocol, data_leakage…), the CRS version it came from, how many rules it holds, how many times it has matched, and whether it is enabled.
The filter buttons above narrow the list by category: All, SQLi, XSS, CMDi, RCE, LFI, SSRF, XXE, SSTI, NoSQLi, Open Redirect, Header Inj., Deserialization, Log4Shell, Protocol, Custom.
The hits figure is the one worth reading. Twenty-nine rulesets are loaded and they overlap heavily; the count is what tells you which earn their place and which have never matched anything on your traffic.
¶ Inside a ruleset
Expand a card to see its rules:
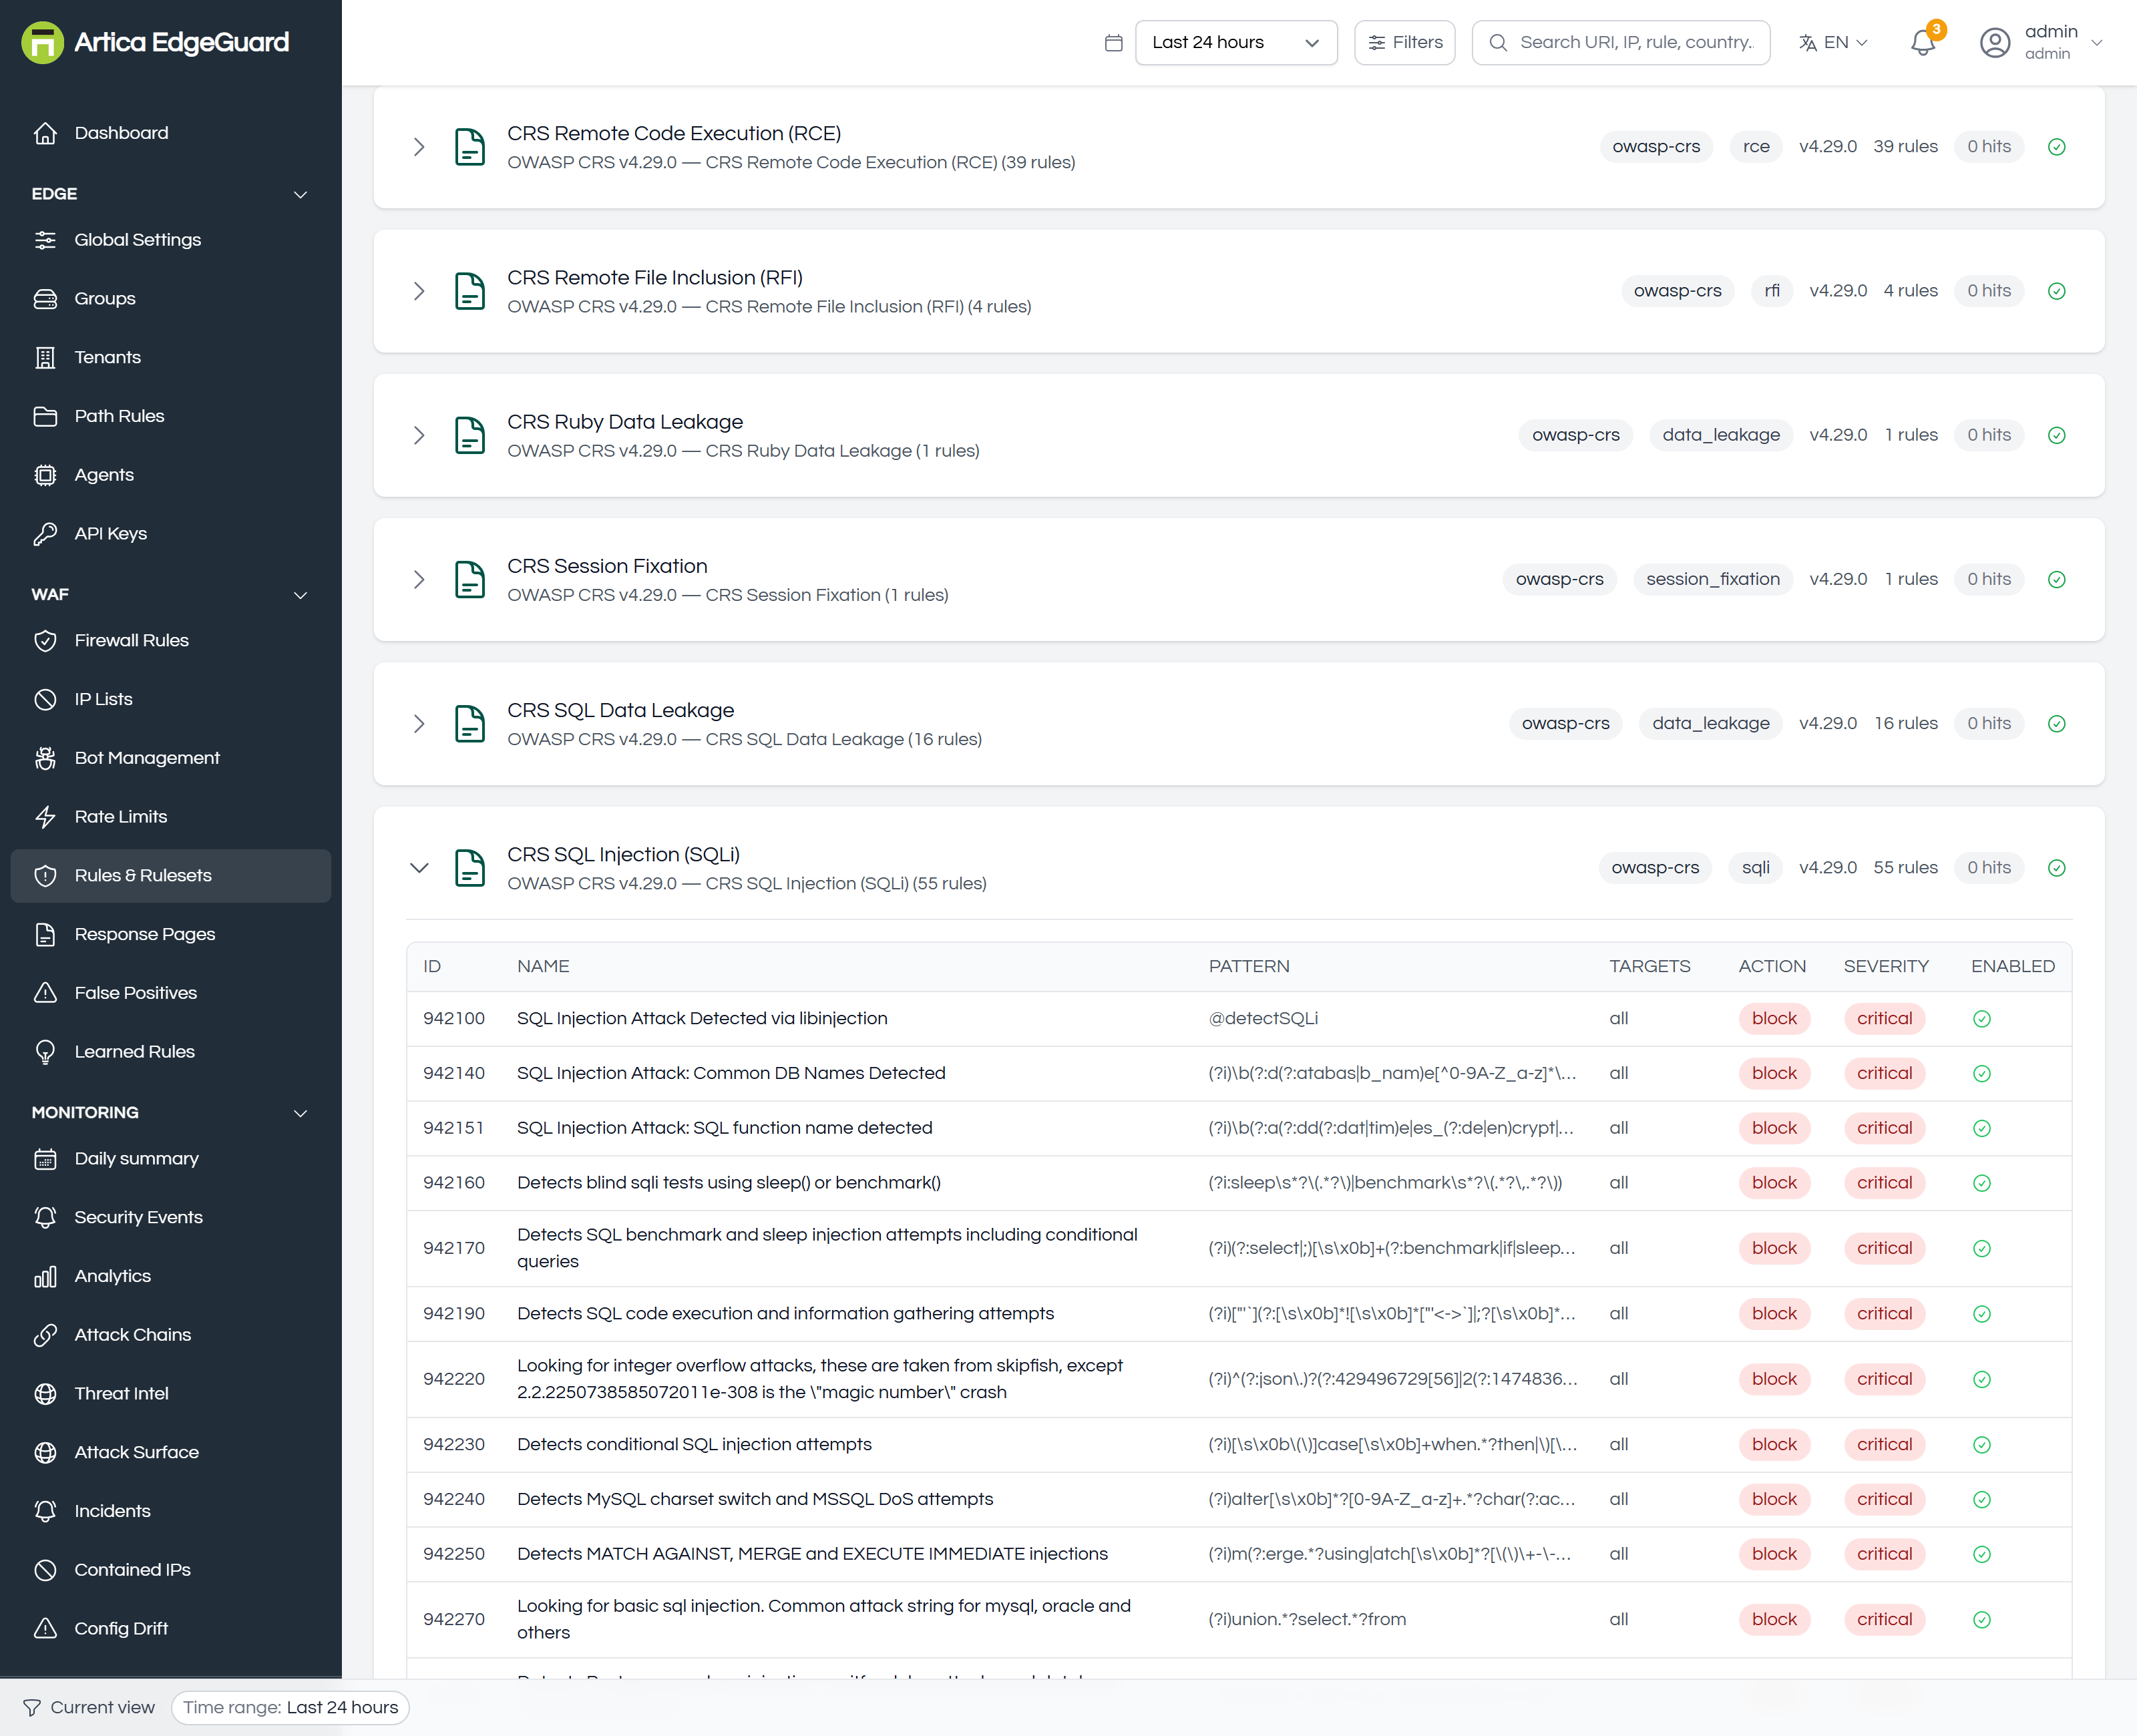
| Column | Meaning |
|---|---|
| ID | the CRS rule number — 942100, 942140… This is the number that appears in an event and in an exclusion |
| NAME | what it detects, e.g. SQL Injection Attack Detected via libinjection |
| PATTERN | the regular expression, or @detectSQLi for the libinjection detector |
| TARGETS | which part of the request it reads: uri, query, args, body, or all |
| ACTION | what it contributes — most are block, meaning "add score toward a block" |
| SEVERITY | critical, error, warning, notice — which is what the score derives from |
| ENABLED | a single rule can be switched off without touching the rest of its ruleset |
Switching off one rule is almost always better than switching off its category, and writing an exclusion for it is better still — see False Positives.
¶ CVE channel
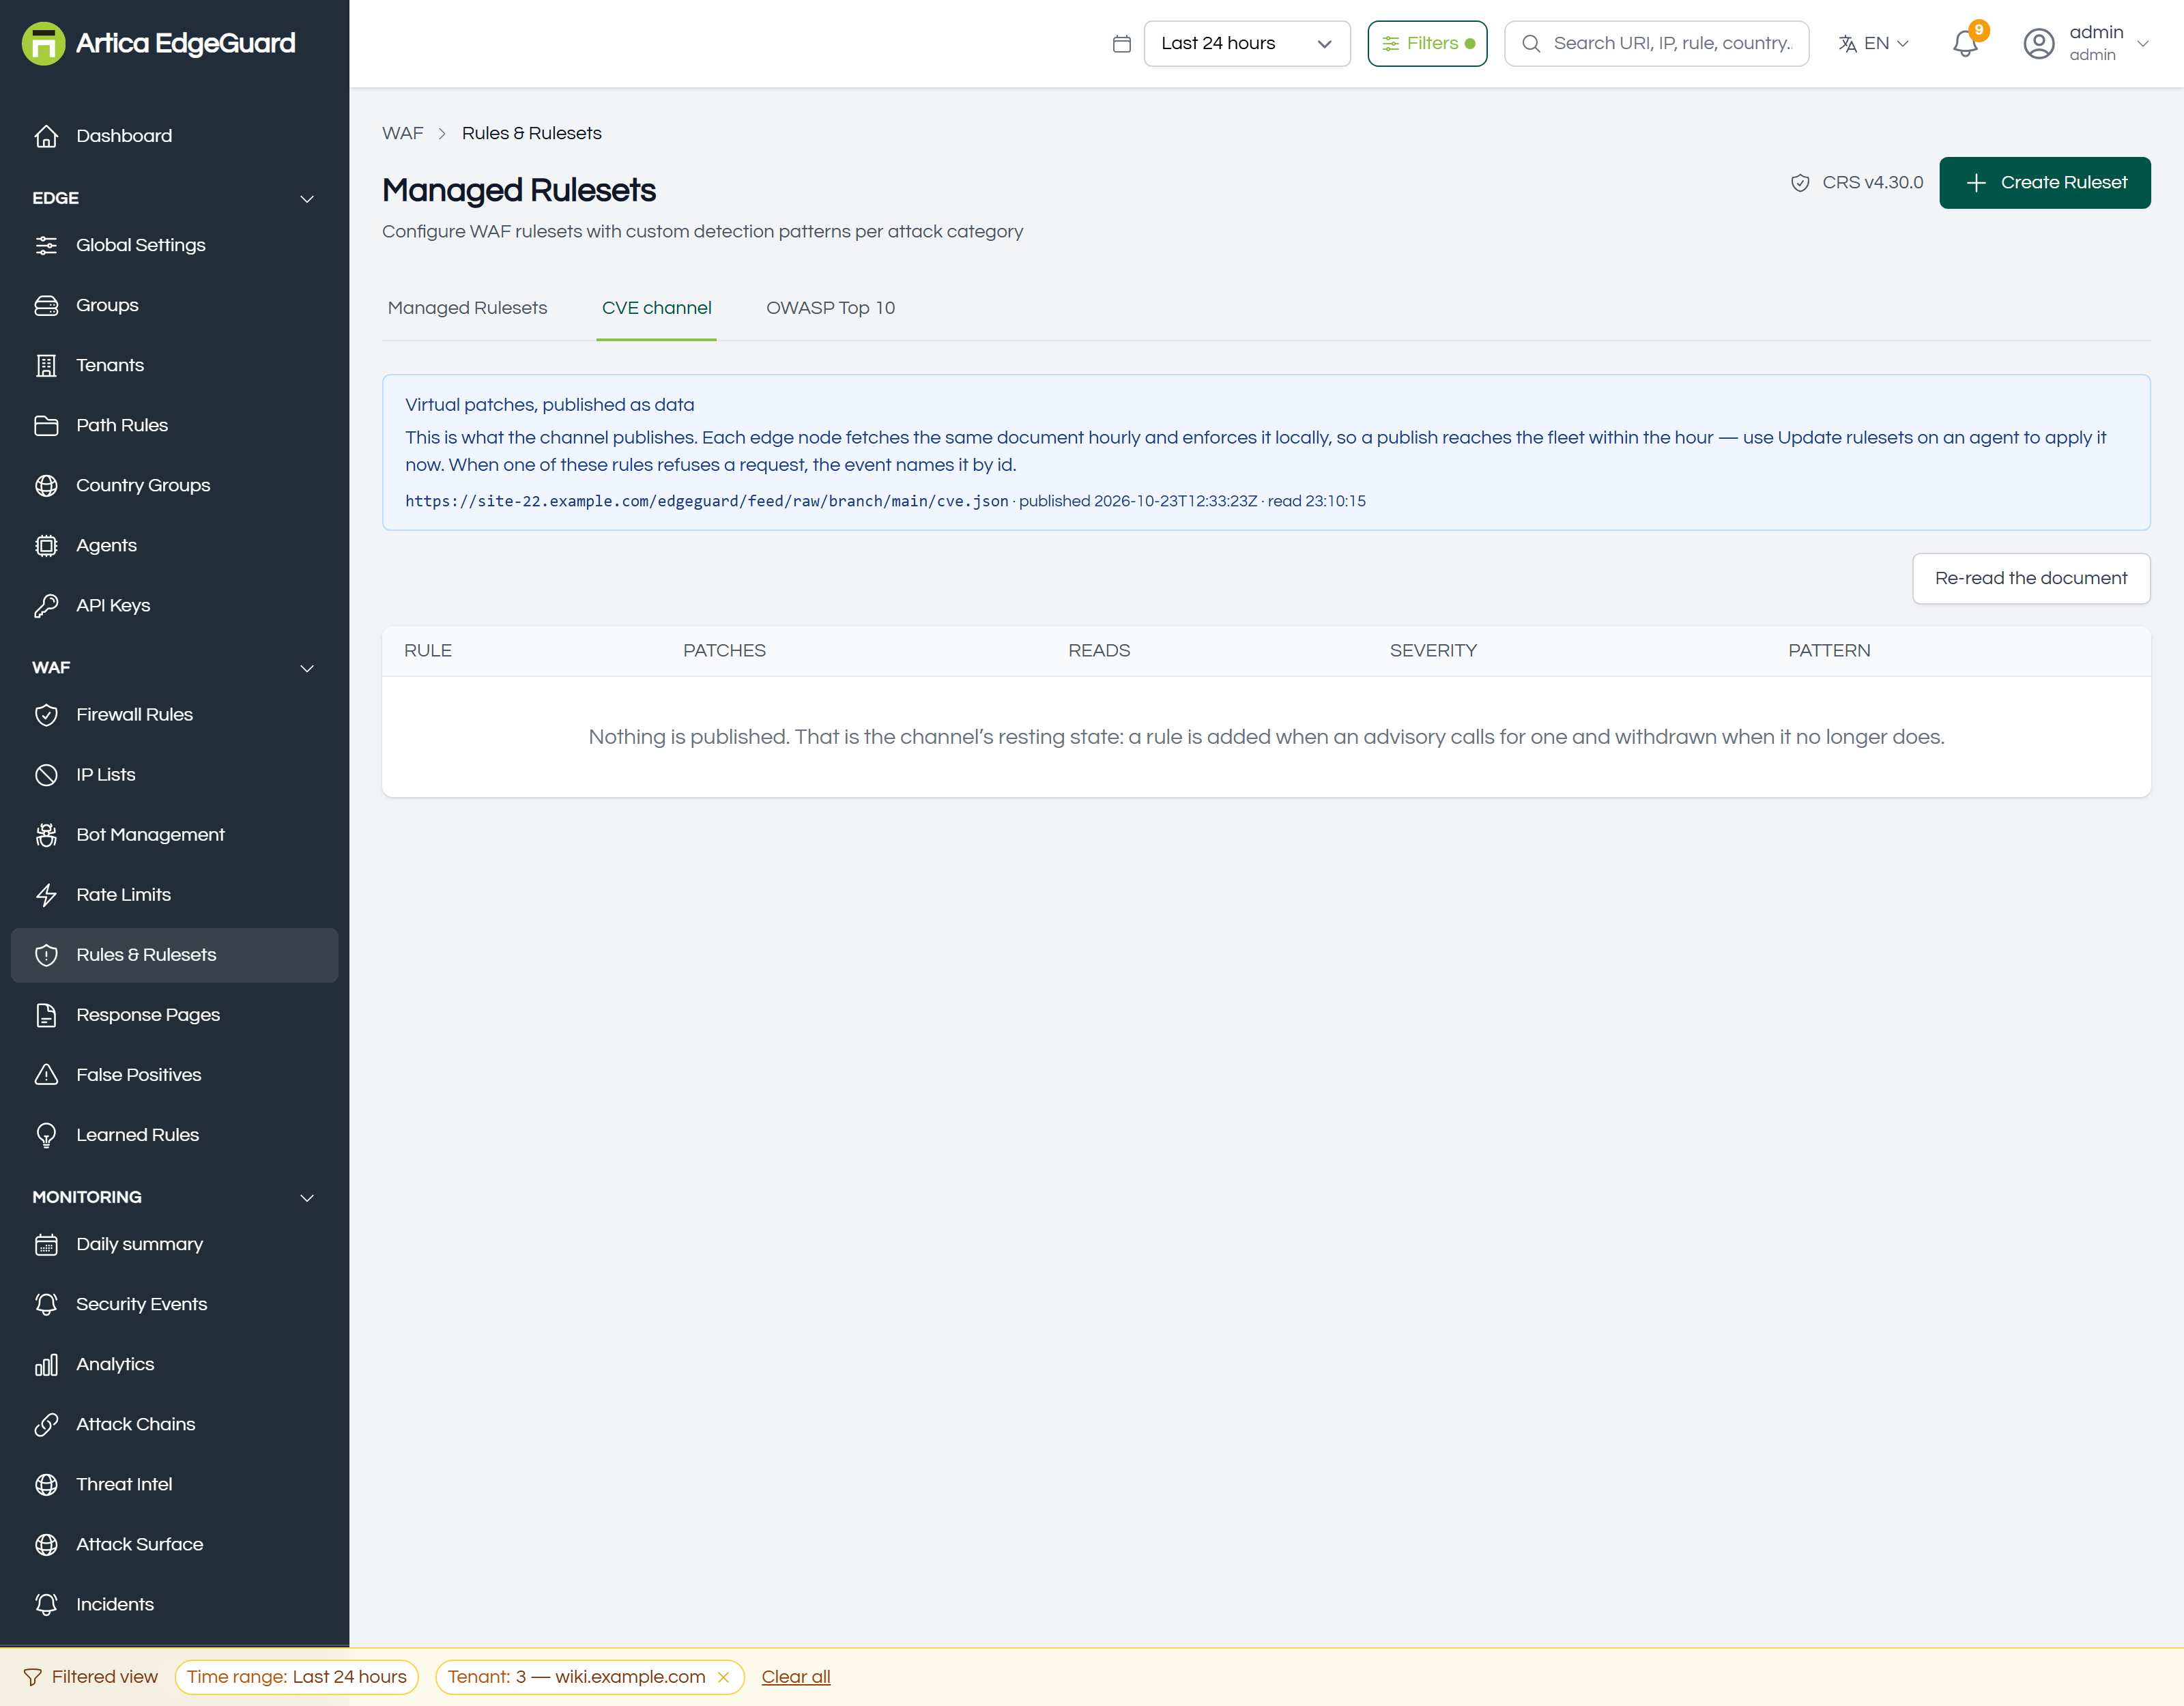
The third tab lists the virtual patches the channel publishes: the rule, the identifiers it patches linked to their NVD entries, what it reads, its severity and its pattern.
It exists because a rule for a newly published vulnerability should not have to wait for an engine release. Each edge node fetches the same document hourly and enforces it locally, so a publish reaches the fleet within the hour — or immediately, with Update rulesets on an agent.
The tab is read from that same document rather than from the rulesets table, and deliberately: the rules the channel ships are owned by the channel, and central does not own them. A node's configuration pull leaves them alone, so a patch that arrived from the channel survives a config change that would otherwise delete anything central does not know about.
Nothing published is the resting state, not a fault. A rule is added when an advisory calls for one and withdrawn when it no longer does; most of the time there is nothing to carry. The panel states this rather than showing an empty table and leaving the reader to guess.
When one of these rules refuses a request, the event names it by id, with its identifiers linked — see PHP2Shell for one read end to end.
¶ OWASP Top 10
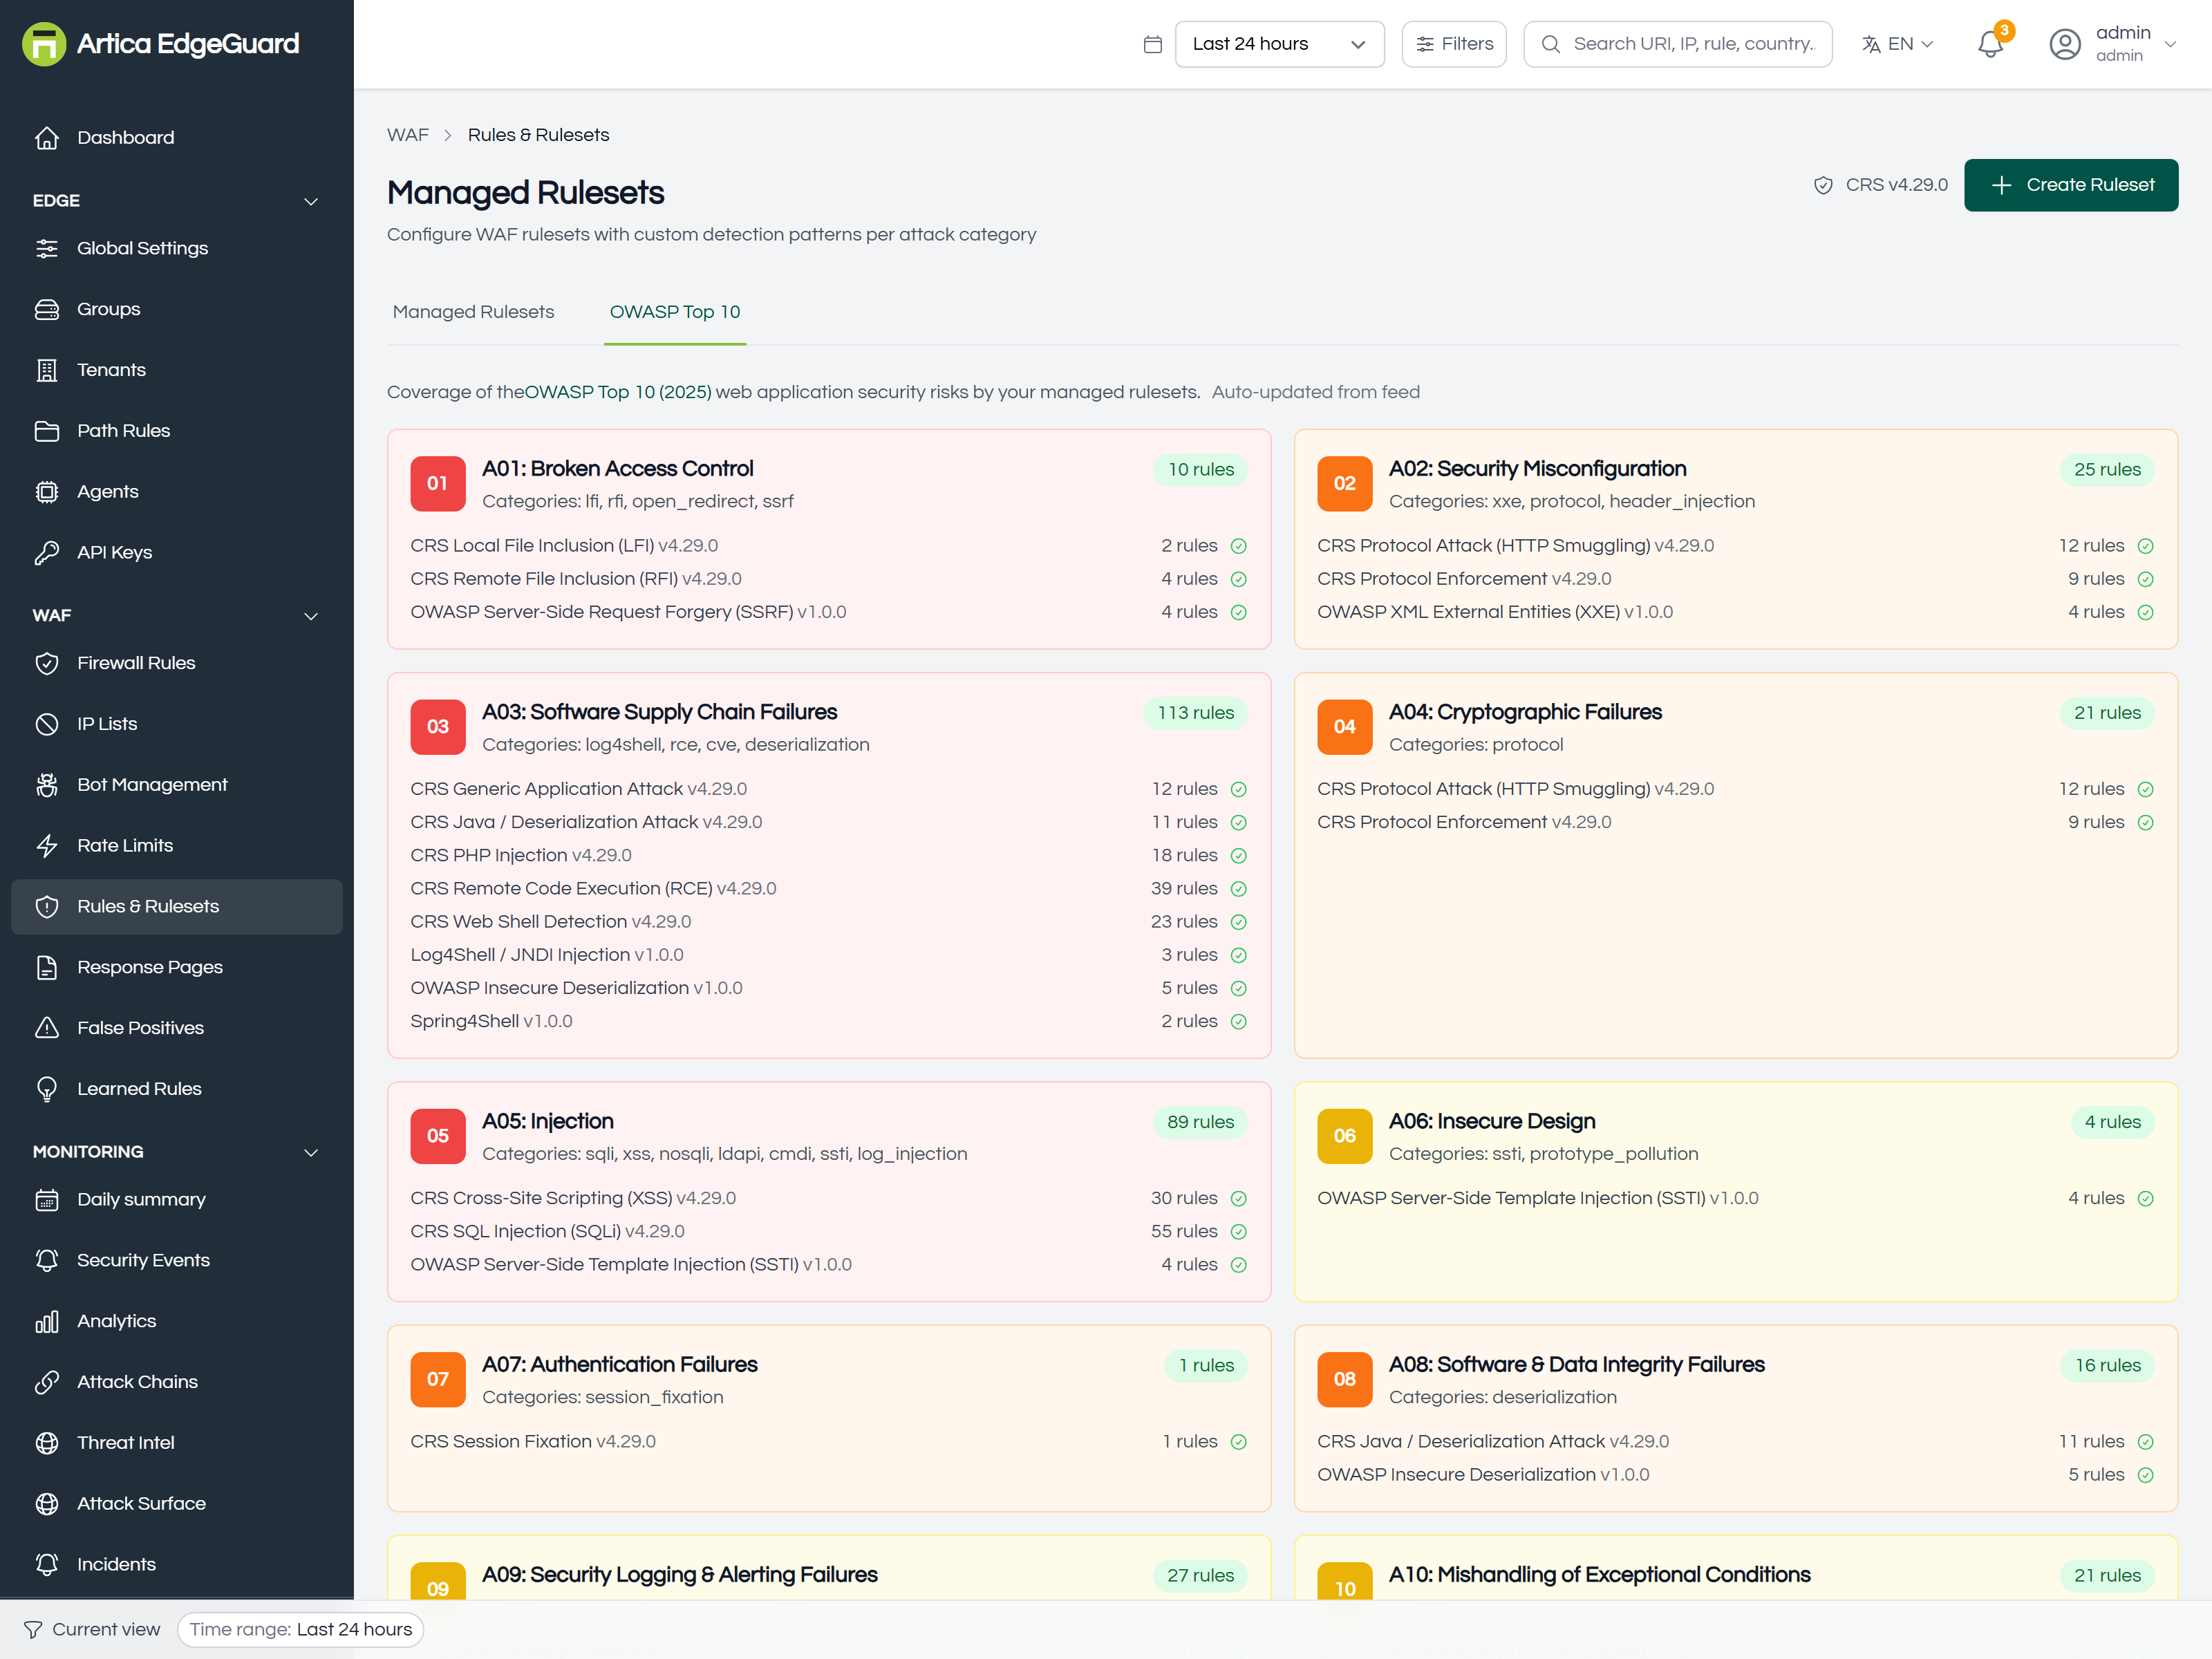
The same protection read the other way round: A01 through A10, and what covers each. This is the view to bring to an auditor, and the quickest way to notice that a category you switched off has left a gap in the Top 10.
¶ Rule Feed Auto-Update
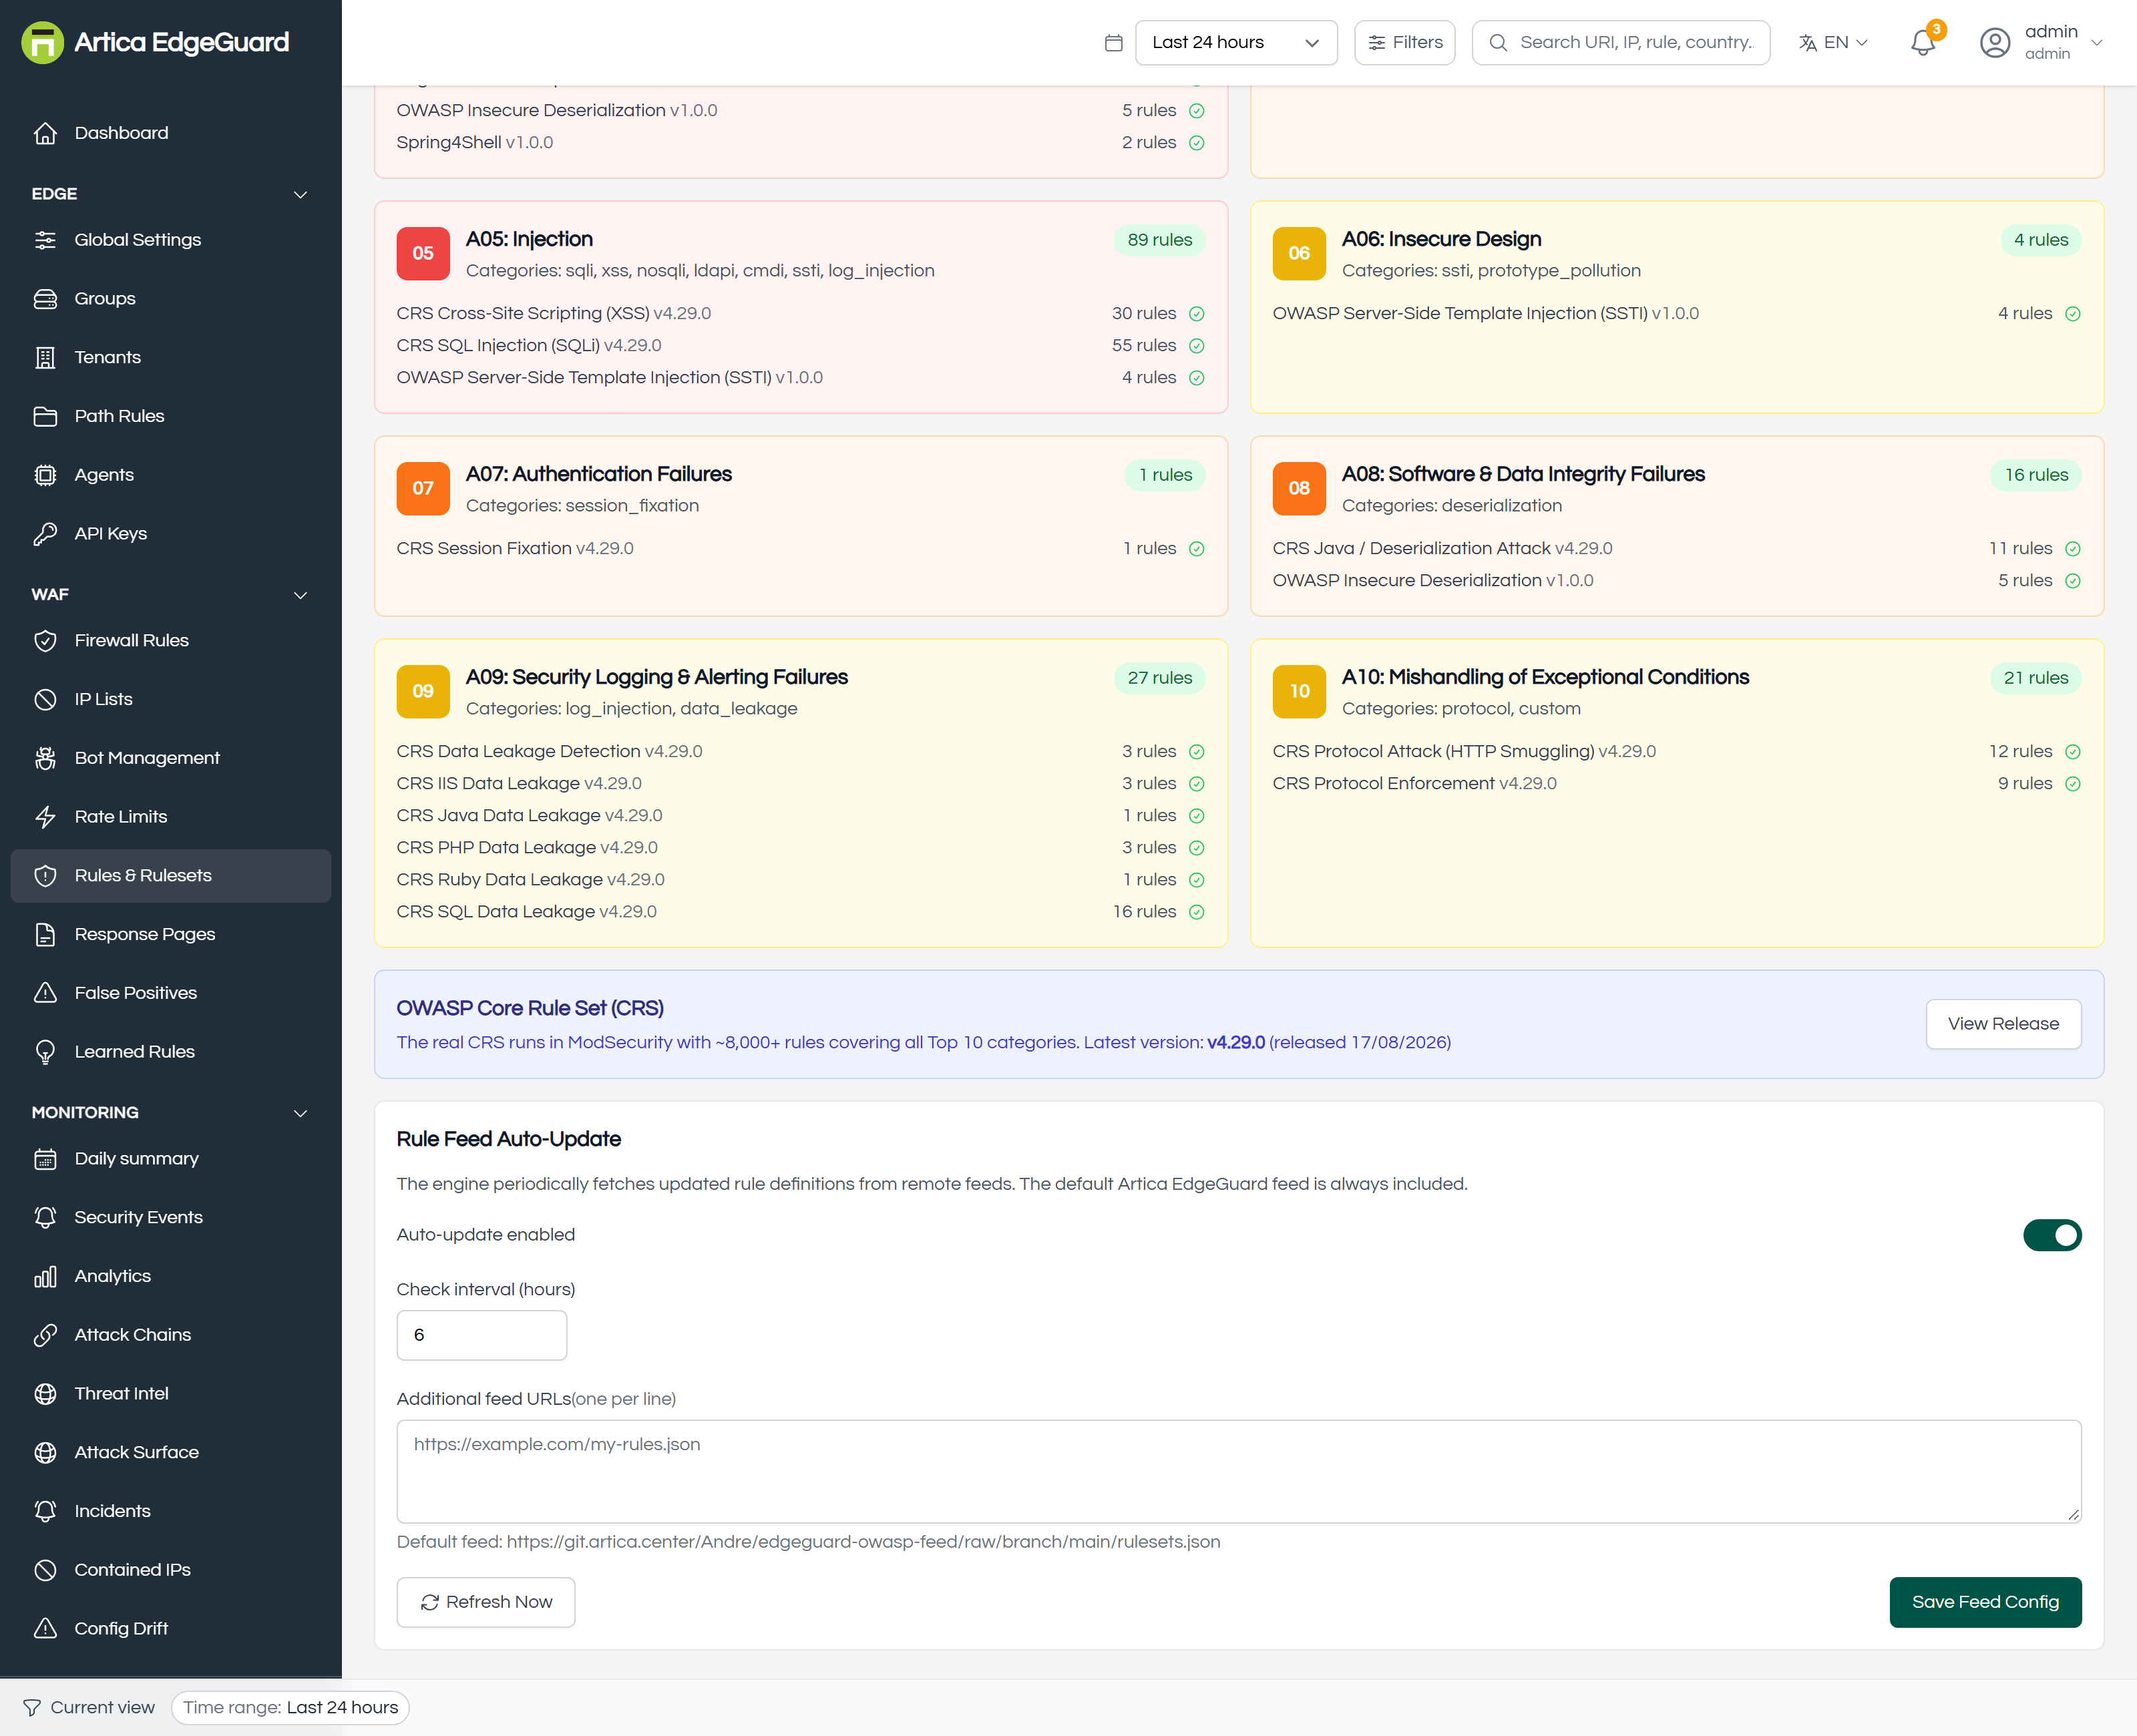
The engine fetches updated rule definitions on a schedule; the Artica EdgeGuard feed is always included.
- Auto-update enabled — whether to fetch at all.
- Check interval (hours) — how often.
- Additional feed URLs — one per line, for your own or a third party's rules.
- Refresh Now — fetch immediately, which is what you use after publishing a rule of your own.
- Save Feed Config — applies the settings.
The current feed version is shown on each ruleset card, so you can tell at a glance whether an agent is running rules from last month.
¶ Writing your own ruleset
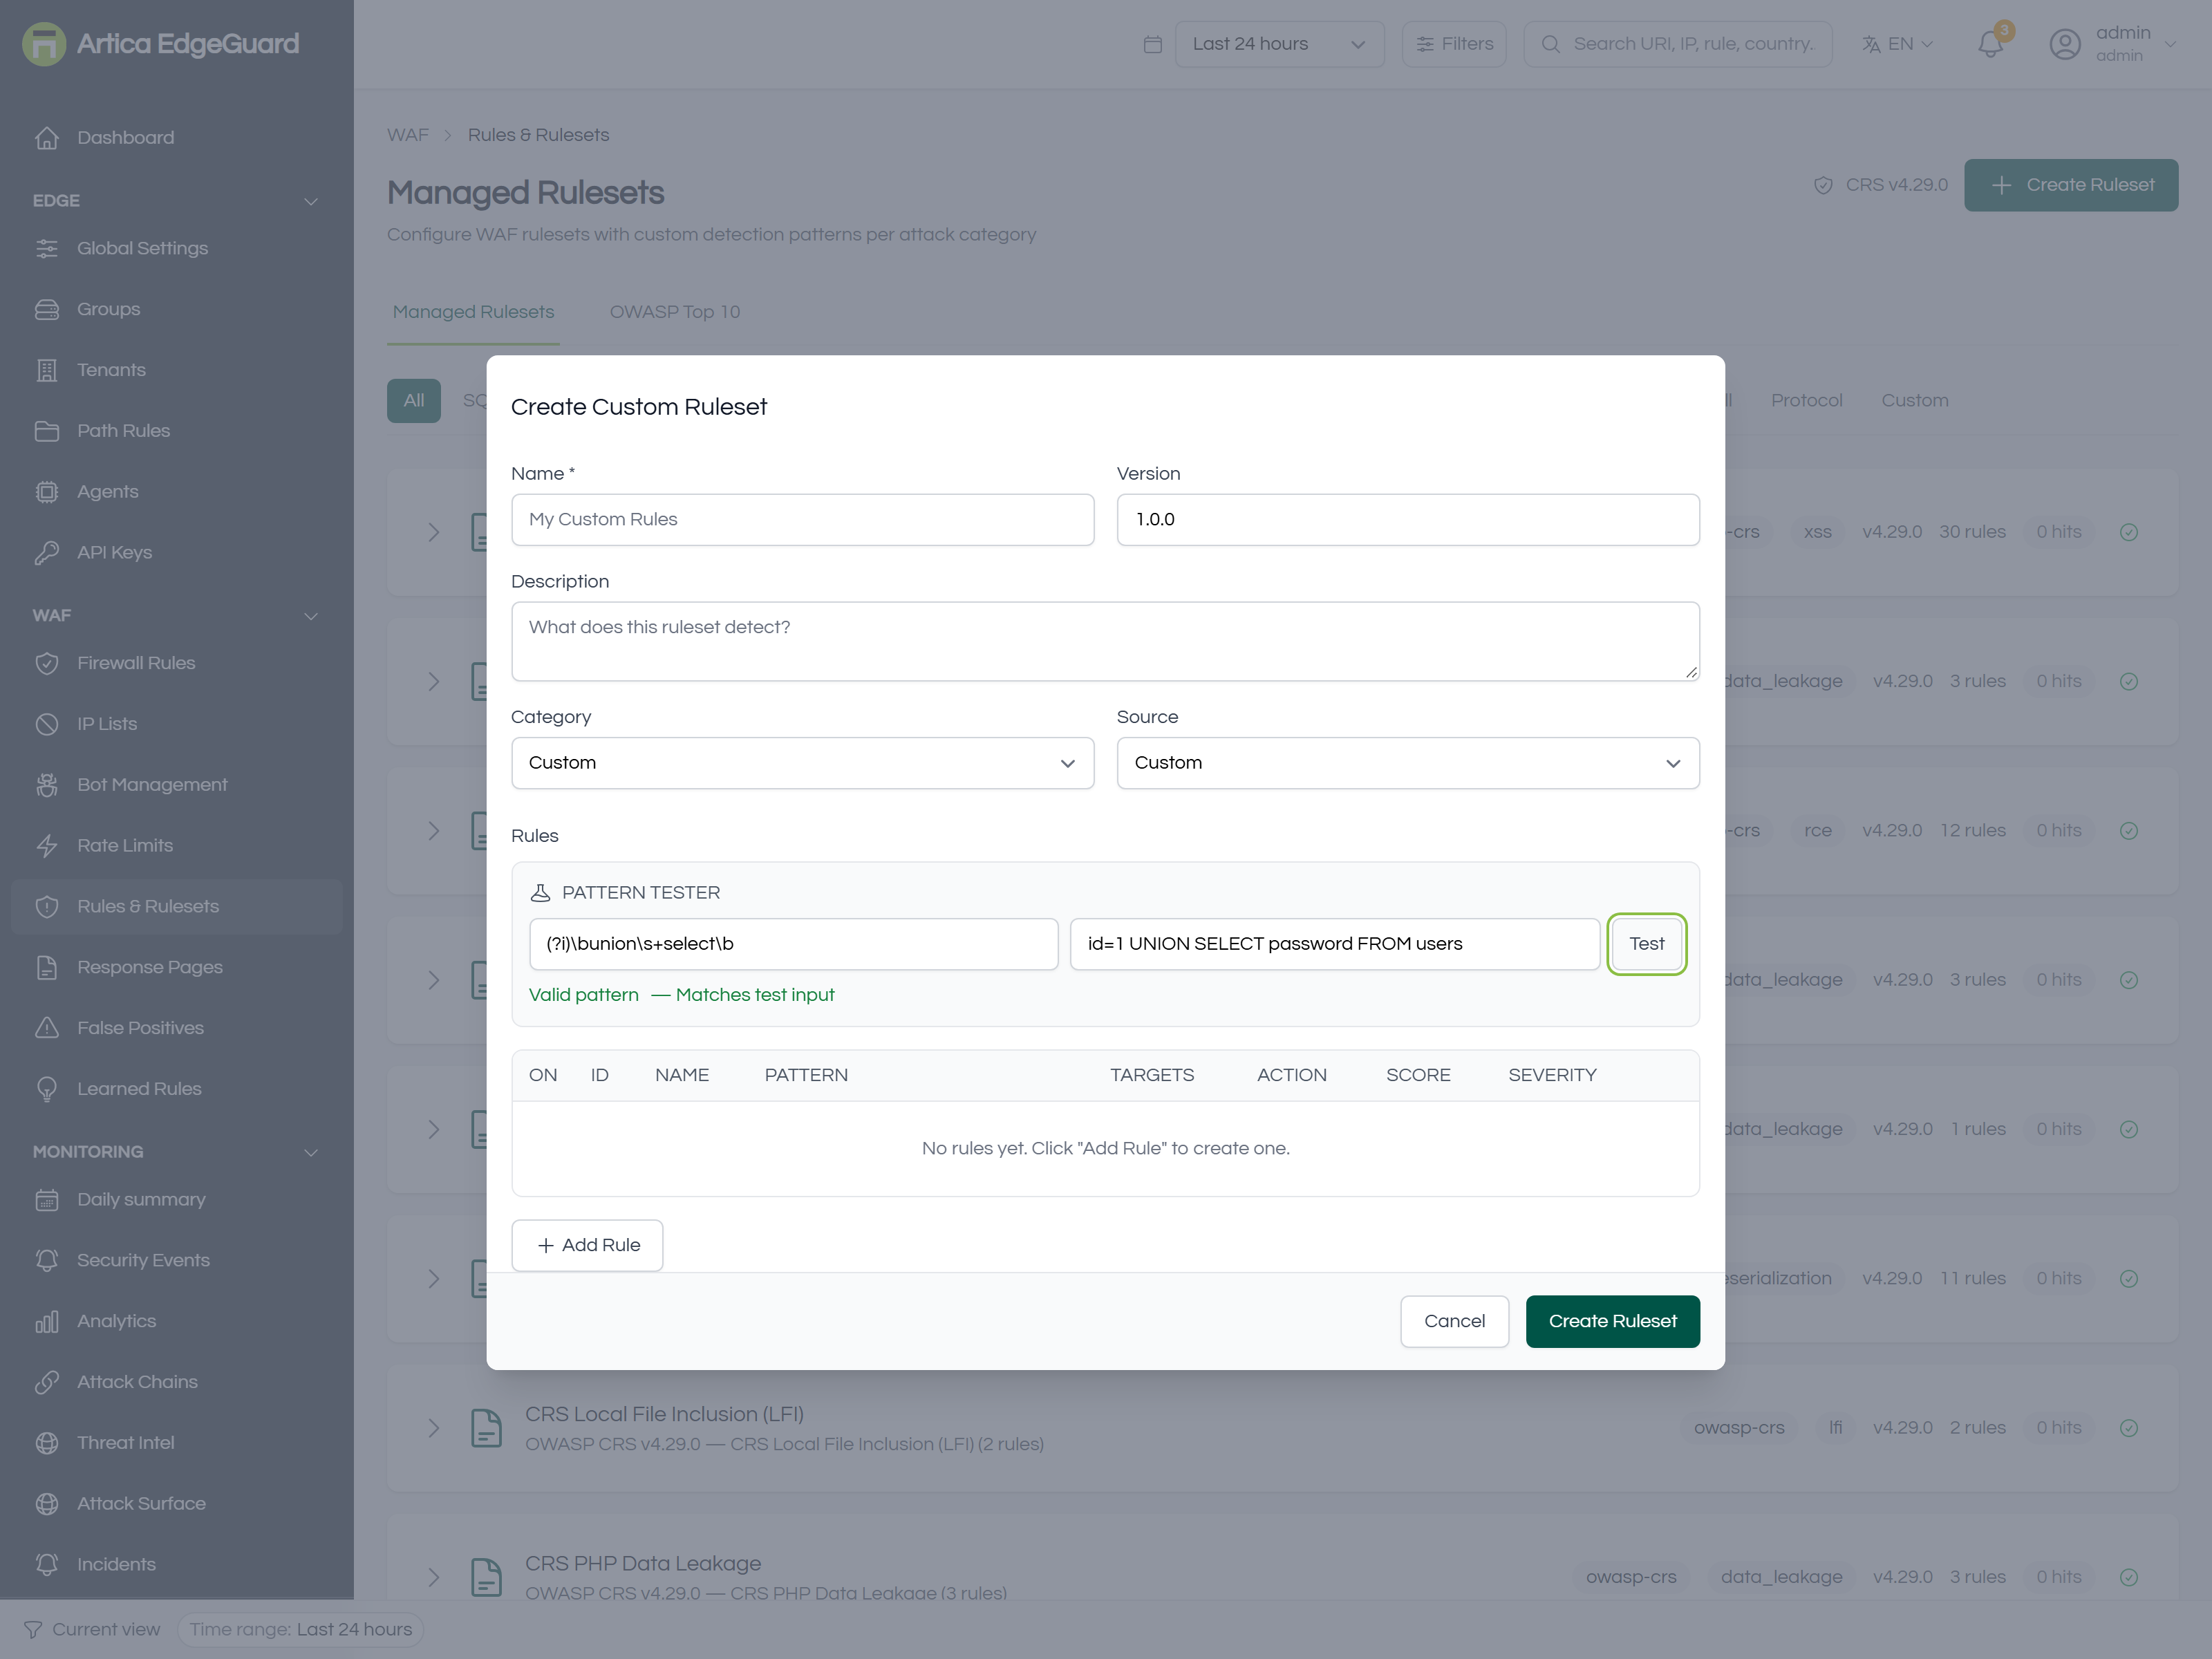
Click Create Ruleset.
- Name, Version and Description — what it detects and why it exists.
- Category — SQLi, XSS, CMDi, RCE, LFI, SSRF, XXE, SSTI, NoSQLi, Open Redirect, Header Injection, Deserialization, Log4Shell or Protocol. The category decides which switch turns it off later, so pick the one an operator would think of.
- Source — Custom, OWASP or CVE. Use CVE when the ruleset exists because of a specific vulnerability; the number belongs in the description.
- Add Rule for each pattern, then for each rule: the regular expression, what it targets, its score and severity.
- Test — paste a sample input and see whether the pattern matches it. Use it on both a payload that should match and one that should not.
- Create Ruleset.
Test every pattern against something that should not match. A regular expression that matches everything looks identical to protection until the first complaint. The Test box exists for exactly this, and it costs ten seconds.
Cost. Your pattern runs on every request that is not a static asset. Avoid nested quantifiers ((a+)+), prefer anchored and specific expressions, and keep the target as narrow as the attack allows — a rule that only makes sense in a body should not read the URI.
¶ Verifying
1. Does the rule match what you meant? Use Test in the builder before saving.
2. Does it fire on real traffic?
curl -o /dev/null -w '%{http_code}\n' \
  -H 'User-Agent: Mozilla/5.0 (Windows NT 10.0; Win64; x64) Chrome/140.0.0.0' \
  "https://site.example.com/?id=1%20UNION%20SELECT%20password%20FROM%20users"
3. What did EdgeGuard think? Open the newest row in Security Events. The detail panel names every rule that matched, what it matched on, the accumulated score and the threshold it was compared against. If the request was allowed, the score will tell you how close it came.
4. Is the ruleset doing work over time? The hits figure on its card, and the Rule Coverage table on Analytics, which lists rules that are firing and rules that are silent in this window.
¶ Tuning, in order of preference
- An exclusion for the one rule on the one path or field that is wrong — narrowest, and it keeps everything else inspecting. See False Positives.
- Disable the single rule inside its ruleset, when it is wrong everywhere rather than in one place.
- A path rule that turns a category off for one endpoint.
- Lower the paranoia level, if you raised it and the noise came with it.
- Raise the anomaly threshold — last, and reluctantly. It weakens every combination of rules, not the one that annoyed you.
The False Positive Rate Estimate table on Analytics is the evidence for which of these you need: it shows, per rule, how many events it produced and how many a person marked as false positives.
Learning mode (Global Settings → General → WAF Operating Mode) is the safe way to introduce a stricter setting: everything is detected and logged, nothing is refused, and the Analytics tables then tell you what would have happened.